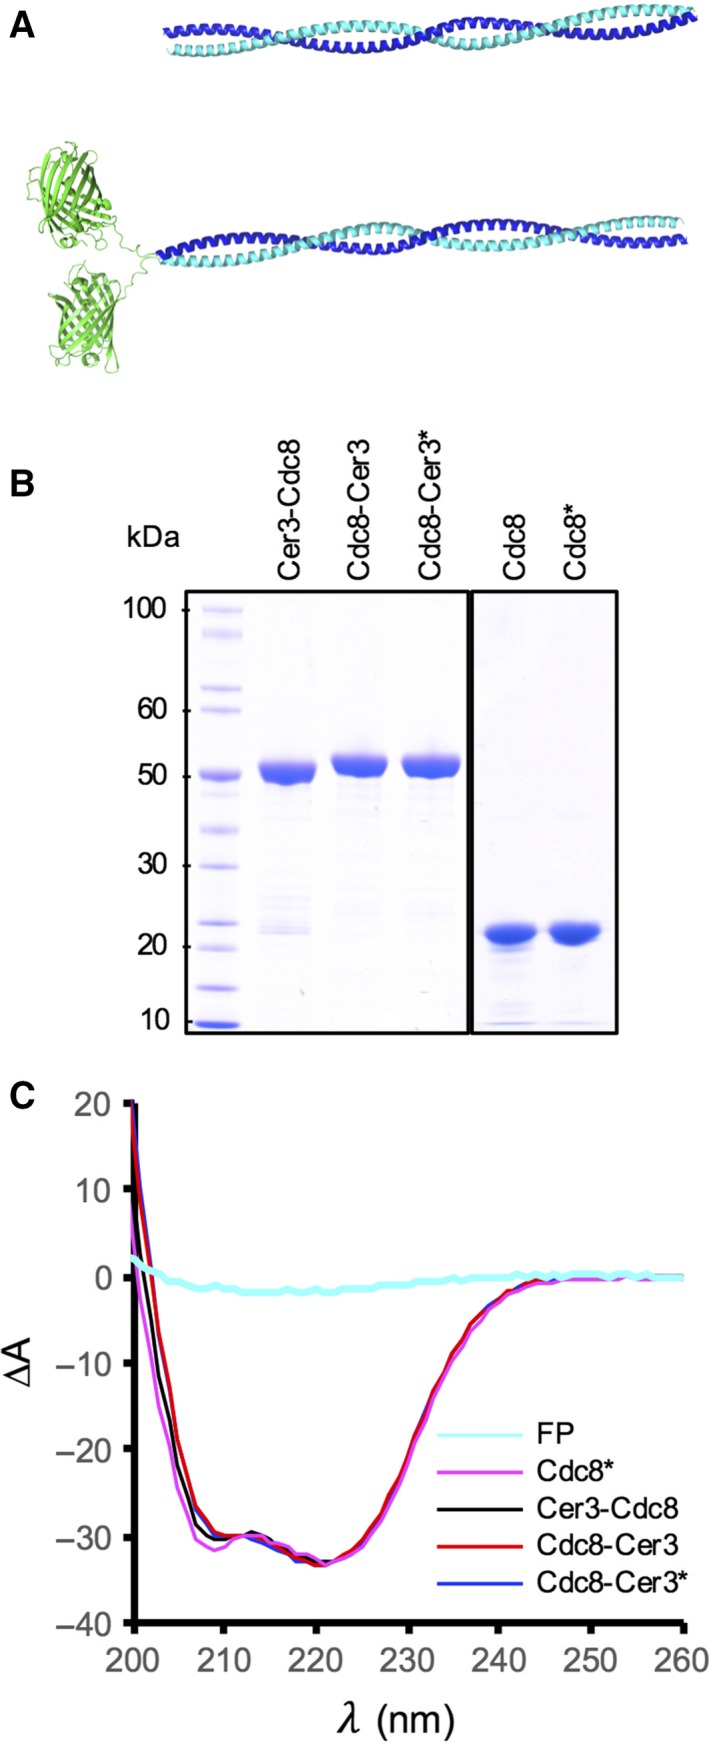
Figure 1.

Tropomyosin proteins used in this study. (A) Predictive models of TpmCdc8 (upper panel) and Cerulean3‐TpmCdc8 (lower panel) dimers. (B) Coomassie blue‐stained SDS/PAGE analysis of purified wild‐type and Cerulean3‐tagged TpmCdc8 proteins. (C) CD Spectra of purified acetylated wt (magenta), amino‐terminally Cerulean3‐tagged (black), and both acetylated (blue) and unacetylated (red) carboxyl‐terminally Cerulean3‐tagged TpmCdc8 proteins. A CD spectrum of a fluorescent protein (cyan) is included for comparison. *Denotes amino‐terminally acetylated protein.
