
Figure 3.
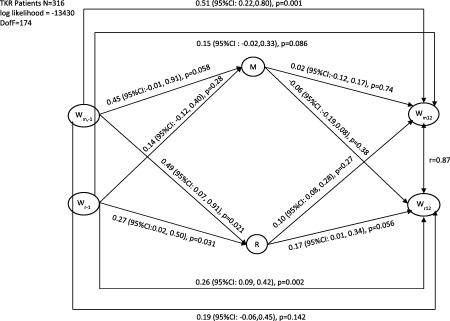
Structural equation model (SEM) of the association between latent variables preoperative WOMAC pain‐on‐movement (Wm,−1), preoperative WOMAC pain‐at‐rest (Wr−1), acute postoperative pain‐on‐movement (M), acute pain‐at‐rest (R), postoperative WOMAC pain‐on‐movement (Wm12), and postoperative WOMAC pain‐at‐rest (Wr12) in total knee replacement (TKR) patients. Arrows indicate direction of effects, coefficients are in the natural units of the measurement scales, and P values are based on z‐distribution. Arrow between Wm12 and Wr12 indicates correlation coefficient. Models are estimated using maximum likelihood allowing for missing values. Full SEM models, including confirmatory factor analysis, are presented in Supplementary Figure 5 (available on the Arthritis Care & Research web site at http://onlinelibrary.wiley.com/doi/10.1002/acr.22656/abstract). 95% CI = 95% confidence interval.