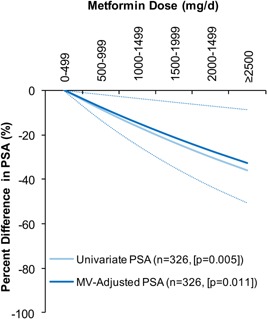
Figure 2.

Regression‐predicted percent difference in serum PSA levels across continuously modeled metformin doses, compared to men using <500‐mg/d metformin. The light solid line presents the univariate relationship in all men (n = 326). The dark solid link presents the multivariate‐adjusted relationship in all men with the dotted line representing the corresponding 95%CIs (n = 326). The multivariate‐adjusted model adjusted for age, ethnicity, BMI, duration of diabetes, serum LDL‐C, glycated hemoglobin, NSAIDs, statins, and thiazide diuretics.
