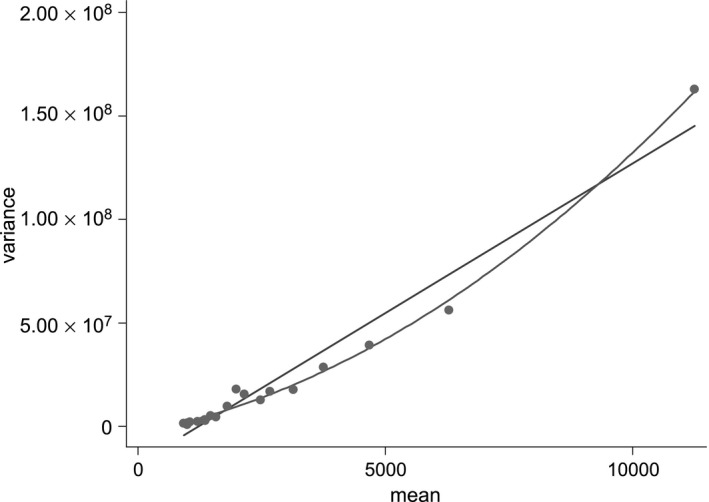
Figure 1.

Variance against mean for each of the 20 quantiles of the linear index of covariates: the data were divided into 20 subsets by using the deciles of a simple linear predictor for healthcare costs with the set of regressors introduced later; the figure plots the means and variances of actual healthcare costs for each of these subsets, with fitted linear and quadratic trends
