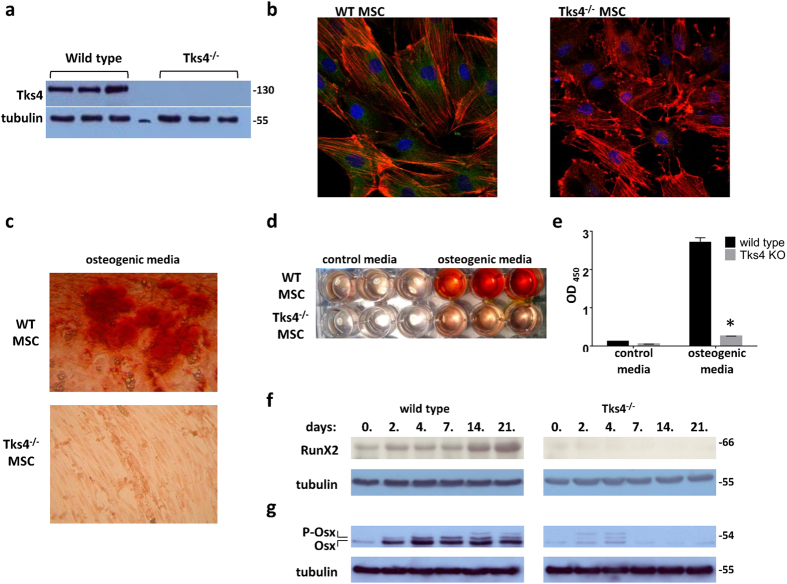
Figure 3. Altered osteogenic differentiation potential of Tks4−/− BM-MSCs.
(a) Western blot analysis of cell extracts from three independent wild type and three independent Tks4 KO BM-MSC lines. Protein samples were subjected to SDS-PAGE followed by immunoblots with anti-Tks4. Tubulin was used to control equal loading. (b) Representative fluorescent images of wild type and Tks4 knock-out cell cultures. BM-MSCs were grown in confocal chambers, fixed, permeabilized and stained. Nuclei were stained with DAPI (blue), actin filaments were fixed/labeled with Phalloidin-TRITC (red) and anti-Tks4 was visualized with Alexa Fluor 488 (green). (c) Wild type and Tks4−/− MSCs were incubated in ODM and pictures were taken after Alizarin Red S staining. Representative pictures of stained cultures in 10x magnification following 14 days of culture, showing the morphology of the cells and (d) the whole plate showing the differences between control and ODM treatment of the Tks4−/− and wild type MSC cultures. (e) Quantification of calcium deposition by detecting the absorbance of Alizarin Red S extracts. Data are represented as mean of OD values of three wells. Time course of (f) RunX2 and (g) Osterix (Osx) osteogenic marker expressions during in vitro osteogenic differentiation of wild type and Tks4−/− BM-MSCs. (g) The phosphorylated form of Osterix (P-Osx) appears as lower mobility bands. Cell lysates were prepared at various time points and Western blot analyses were performed. Gels were run simultaneously under the same experimental conditions. Tubulin was used to control equal loading. *p < 0.05. An unpaired t-test was used to determine the significance of the difference between means of two groups. Error bars represent s.d.

