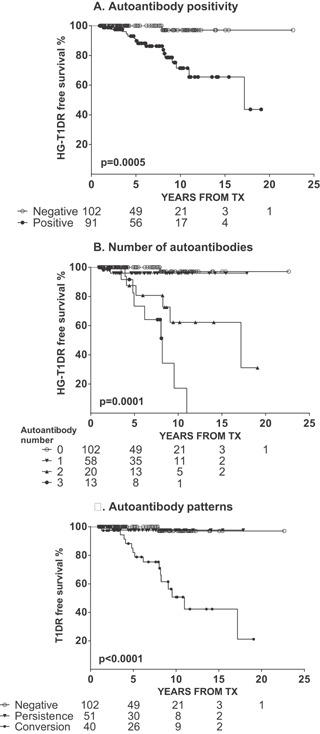
Figure 4.

Kaplan–Meier analysis of HG‐T1DR‐free survival according to autoantibodies on follow‐up. (A) Autoantibody positivity: positive versus negative, HR = 14.53, p = 0.0005; (B) number of autoantibodies: overall, p = 0.0001; 1 versus 0, HR = 3.53, p = 0.2672; 2 versus 0, HR = 14.60, p = 0.0005*; 3 versus 0, HR = 53.88, p < 0.0001*; 2 versus 1, HR = 5.65, p = 0.0131**; 3 versus 1, HR = 17.04, p<0.0001*; 3 versus 2, HR = 3.00, p = 0.0261**; p value *was or **was not significant after correction for multiple comparisons. (C) Autoantibody conversion:overall, p<0.0001; persistence versus negative, HR = 1.88, p = 0.6486; conversion versus negative, HR = 27.11, p < 0.0001*; conversion versus persistence, HR = 15.57, p = 0.0003*; *significant p values after correction for multiple comparisons. HG‐T1DR, hyperglycemia with type 1 diabetes recurrence.
