
Figure 2.
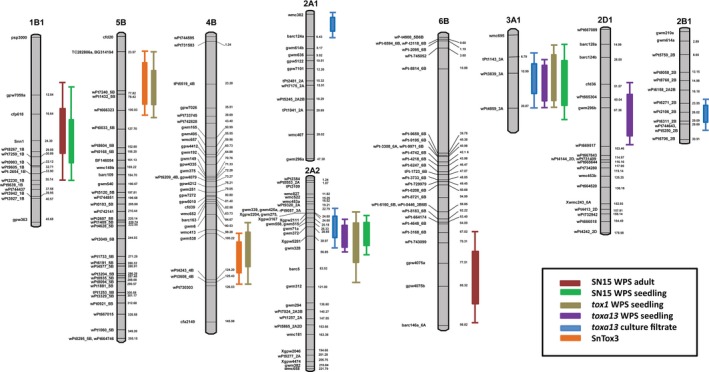
Composite interval mapping of quantitative trait loci (QTL) associated with toxa13 CF sensitivity and SNB caused by SN15, tox1–6 and toxa13.
Genetic maps of the chromosomes with genetic markers on the right and the centimorgan (cM) distances between loci are shown on the left. Snn1 (bold) was mapped as a trait marker in 1B1 in response to the SnTox1 effector.