Figure 3.

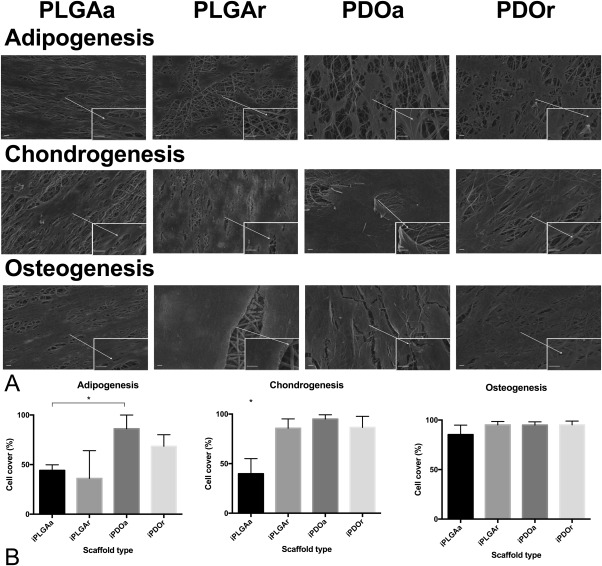
Higher adipogenic and chondrogenic cell coverage on PDO scaffolds. (A) SEM images of each scaffold type at a 1000× magnification (scale bar = 10 μm) with a 5000× magnification image (scale bar = 2 μm) in bottom right hand corner showing cells at day 14 of culture in adipogenic, chondrogenic, and osteogenic medium. The percentage cell coverage at day 14 of culture on each scaffold type was calculated from SEM images for cells in (B) adipogenic, chondrogenic, osteogenic inducing medium. n = 3 MSC donors.
