
Figure 3.
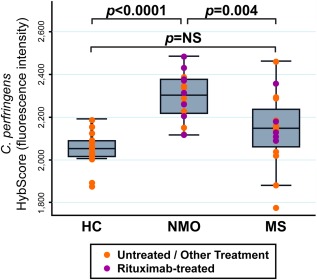
Clostridium perfringens abundance in neuromyelitis optica (NMO), multiple sclerosis (MS), and healthy controls (HC). The y‐axis represents the HybScore (integers of fluorescence intensity). Purple dots represent individual values for patients receiving rituximab; orange dots represent patients receiving treatment other than rituximab, or no treatment. The p value for this analysis of variance F test was p < 0.0001. Post hoc tests (Bonferroni) were used to assess pairwise comparisons. C. perfringens abundance was significantly increased in NMO versus HC (p < 0.0001) and in NMO versus MS (p = 0.004). C. perfringens was numerically, but not statistically, increased in abundance in MS samples versus HC. NS = not significant.