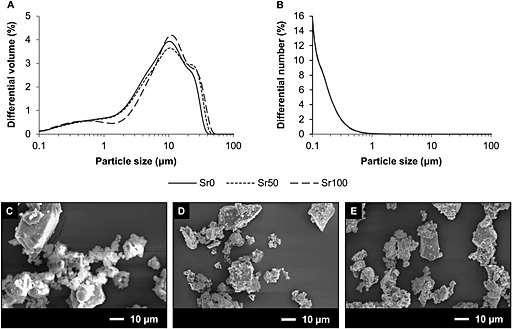
Figure 1.

(A) Differential volume (%) distribution of particle sizes of Sr0, Sr50 and Sr100 bioactive glass powders. (B) Differential number (%) distribution of particle sizes of Sr0, Sr50 and Sr100 bioactive glass powders. Only one line can be observed in (B) due to the overlap of the data for the three samples. (C–E) SEM images of Sr0, Sr50 and Sr100 bioactive glass powders, showing great variation in particle shape and size within each sample
