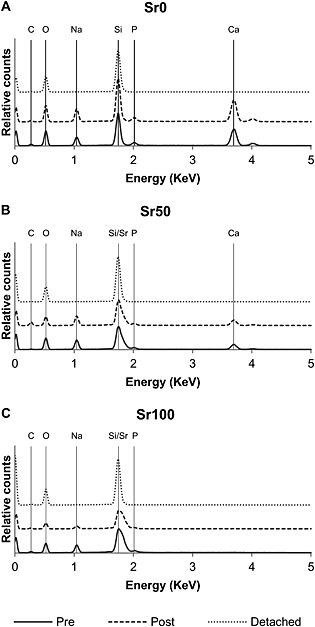
Figure 4.

Energy‐dispersive spectra patterns for (A) Sr0, (B) Sr50 and (C) Sr100 bioactive glass samples, before and after the solubility studies were performed: Pre, bioactive glass surface before the solubility study was performed; Post, bioactive glass surface after the solubility study was performed and the modified surface layer was removed; Detached, sample of the modified and detached bioactive glass surface layer after the solubility study was performed
