. 2016 Sep 23;19(3):231–241. doi: 10.4048/jbc.2016.19.3.231

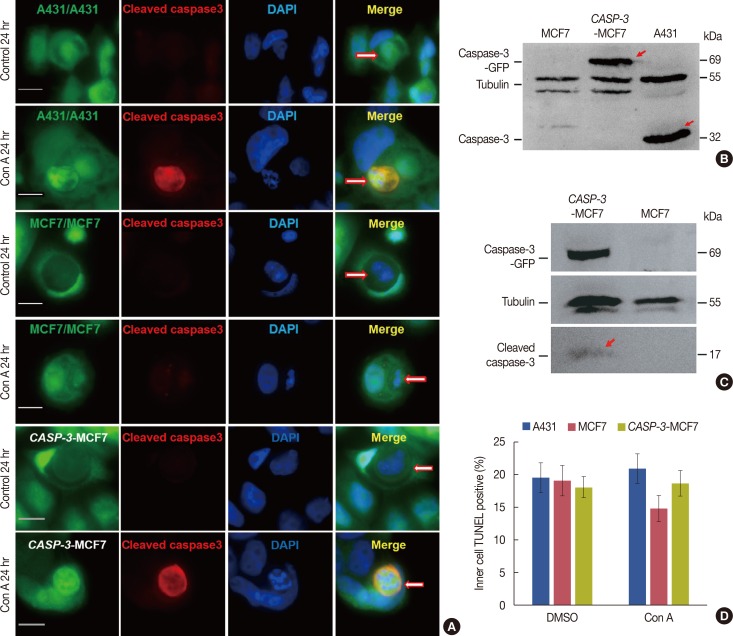
Figure 4. Entosis converting to apoptosis in the presence of caspase-3. (A) Immunofluorescence of cleaved caspase-3 activity in A431 cells, caspase-3 expressing MCF-7 cells and MCF-7 cells with or without concanamycin A (con A) treatment. The three kinds of cells showed typical lysosomal cell-in-cell death before treatment. After treatment we could see clear caspase-3 activation, nuclear shrinkage, nuclear pyknosis and other apoptotic forms in A431 and caspase-3 expressing MCF-7 cells. In contrast, no caspase-3 activity or other apoptosis characteristics was detected in MCF-7 cells after the same treatment. These pictures were taken after 24 hours of cell incubation. The scale bars are 10 µm. Arrows point to entosis cells. (B) Result of Western blot showed fusion protein caspase-3-green fluorescent protein (GFP) (arrows marked) expressed in caspase-3 expressing MCF-7 cells which was about 69 kDa. (C) Result of Western blotting showed caspase-3-GFP (69 kDa) and cleaved caspase-3 (17 kDa, arrow marked) were detected in caspase-3 expressing MCF-7 cells but not in MCF-7 cells. Both of the cells were treated with staurosporine for 16 hours. (D) Statistical analysis of cell-in-cell death of A431 cells, caspase-3 expressing MCF-7 cells and MCF-7 cells with or without Concanamycin A treatment for 48 hours determined by terminal-deoxynucleotidyl transferase mediated nick end labeling (TUNEL) assay. Data are presented as means±SD.

Figure 4