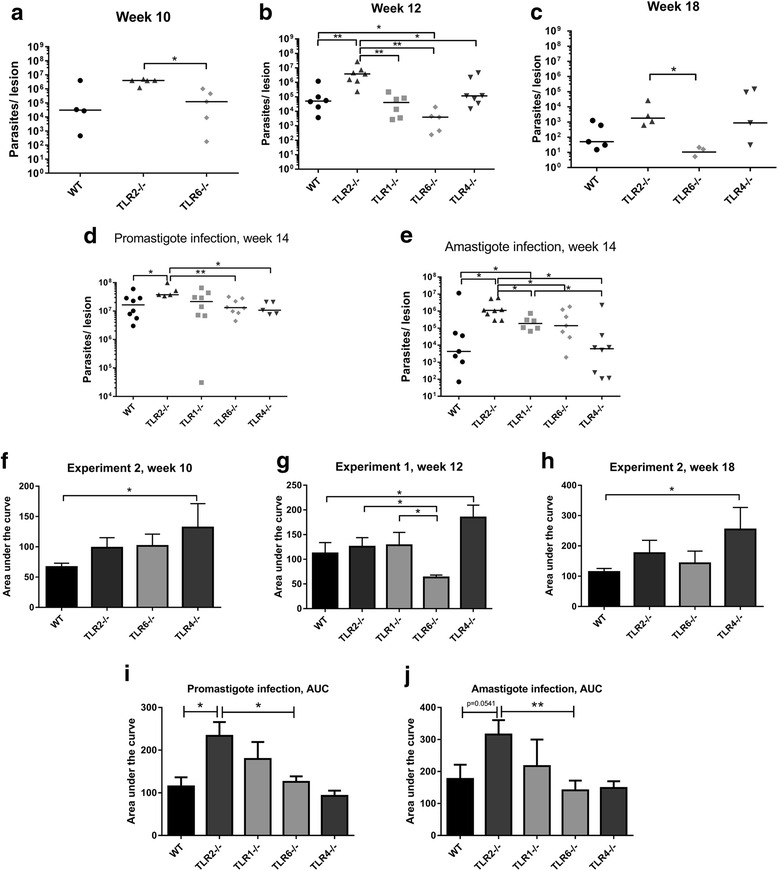
Fig. 2.

Parasite burden and area under the curve (AUC) analysis. Parasite burden and area under the curve data was calculated for WT and TLR−/− mice infected with either L. major (a, b, c, f, g, h) or L. mexicana promastigotes (d, i) or amastigotes (e, j) at various time points post-infection. At the time points indicated, experiments were ended and the lesion tissue from infected mice was collected for quantification of the parasite burden using qPCR. The individual parasite burden levels are shown for L. major (a, b, c) as well as L. mexicana promastigote (d) and amastigote (e) infections, with the median average for each group shown. The lesion size data for each experiment can be summarized by calculating the AUC for each mouse at the end of the experiment; the data are presented in f, g, h for L. major and i, j for L. mexicana. The mean average for each group is represented by the bars, + SEM. Groups were compared using a Mann-Whitney U test where P < 0.05 was considered to indicate significant (*) differences
