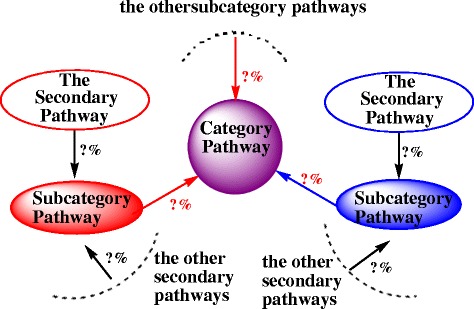
Fig. 2.

The decision tree of KEGG pathways according to the decision percentage. The red sign ‘?%’ denotes the decision percentage of KEGG subcategory pathway to its corresponding category pathway. Similarly, the black sign ‘?%’ denotes the decision percentage of the secondary KEGG pathway to its corresponding subcategory pathway. In addition, the activated KEGG subcategory pathways were marked with red color, the inhibited KEGG subcategory pathways were marked with blue color. In the same way, the activated secondary KEGG pathways were marked with red circles; the inhibited secondary KEGG pathways were marked with blue circles
