Fig. 3.

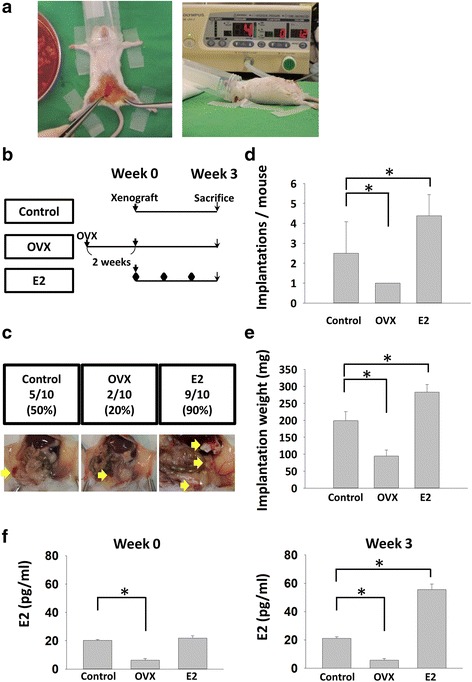
Oestradiol (E2) increased implantation numbers and implantation weight per mouse and depletion of oestrogen had contrary results. a Xenograft and insufflation procedures. b and c Flow chart and representative pictures of the xenografted PM mouse model. Mice were sacrificed in 3 weeks after xenograft procedures. d and e Compared with control group, there were fewer implantations and weight of implantations in the OVX group, while there were more implantations and weight of implantations in the E2 group. f E2 levels of control, OVX and E2 groups at Week 0 and 3. Implantations/mouse stands for implanted uterine myoma numbers per mouse at sacrifice; implantation weight (mg) stands for the total weight of implanted uterine myoma per mouse (* P < 0.05)
