Fig. 7.

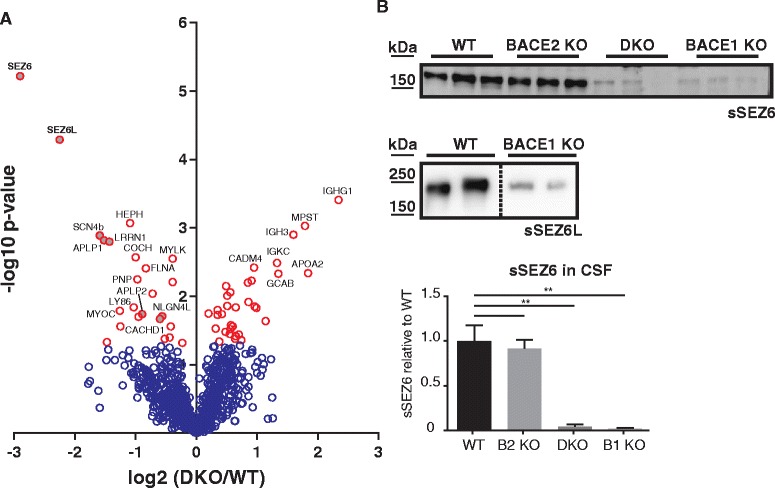
Proteomic analysis of CSF from BACE DKO and WT mice. a Volcano plot of proteomic analysis of BACE1 and BACE2 double knockout (BACE DKO) and WT mouse CSF. The minus log10 transformed t-test p-values are plotted against the log2 transformed label-free quantification intensity ratios of BACE DKO and WT CSF for every relatively quantified protein. Proteins with a t-test p-value < 0.05 are shown as red circles. Already known BACE substrate candidates with a p-value < 0.05 are marked with gray filling. Proteins that remain significant after Benjamini-Hochberg false discovery rate correction (FDR < 0.05) have bold letters (SEZ6 and SEZ6L). b Detection of sSEZ6 and sSEZ6L in mouse CSF. Densitometric quantitation of the Western blot is shown, (**; p < 0.01, one-way ANOVA followed by two-tailed Student’s t-Test, n = 3). The dotted line indicates that the samples were loaded onto the same blot, but not next to each other
