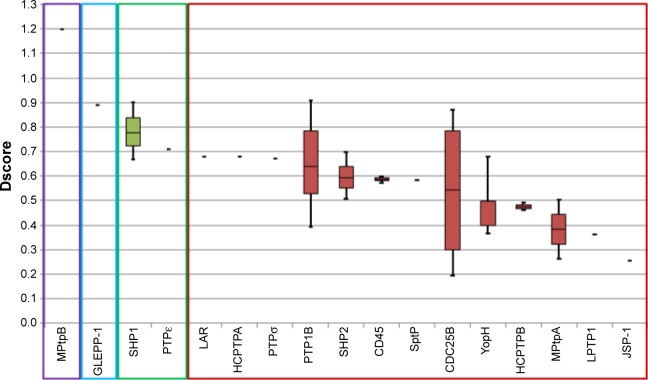
Figure 2.
Box plots showing the range and distribution of druggability for each PTP across available structures passing imposed filters.
Notes: Ranked by median Dscore. Colors indicate druggability classification: purple, very druggable; blue, druggable; green, intermediate; and red, difficult.
Abbreviations: Dscore, druggability score; PTP, protein tyrosine phosphatase.

