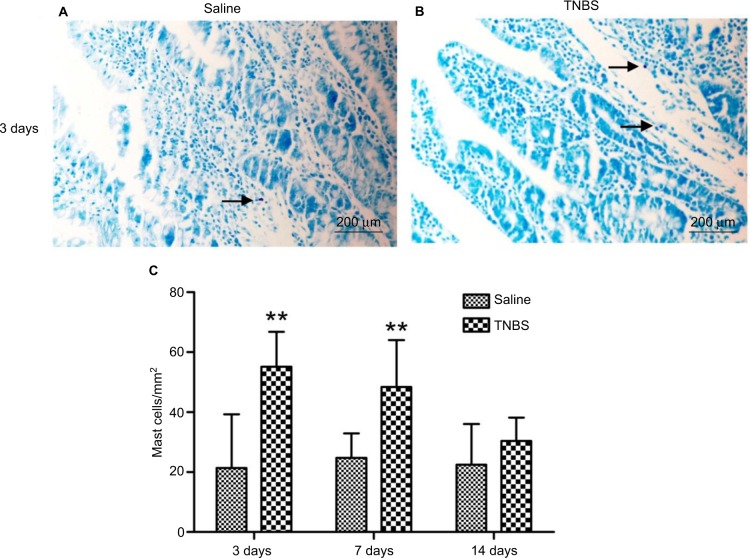
Figure 5.
Effects of 2,4,6-trinitrobenzenesulfonic acid (TNBS) administration on mast-cell counts.
Notes: Ilea of goats 3, 7, and 14 days after treatment (20× magnification, stained using toluidine blue). Arrows show the mast cells in (A) Saline treated group and (B) TNBS treated group. (C) Mast cell counts in ilea of TNBS-treated goats and saline-treated goats were 55.12±11.62 (P=0.019) and 48.37±15.63 (P=0.004) on days 3 and 7. Graphs represent mean ± standard deviation (n=6 samples). **P<0.01 compared to the saline group. (Kruskal–Wallis analysis of variance followed by Mann–Whitney test).

