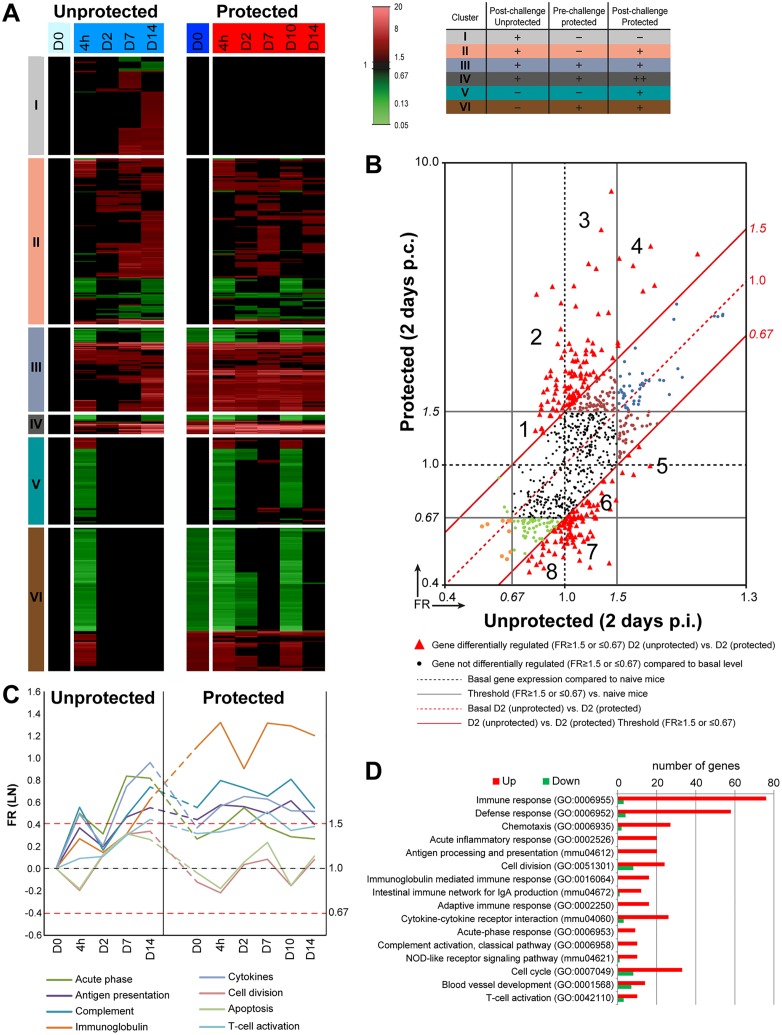
Fig 2. Pulmonary gene expression profiles in protected and unprotected mice following a B. pertussis challenge.
(A) Fold changes in gene expression of both unprotected and protected mice were calculated compared to naive mice (D0 unprotected). The expression results (FR≥1.5, p-value≤0.001) are visualized as heatmap (mean of n = 3). Genes not exceeding a fold change of 1.5 are depicted as basal level (black) at this time point. In total, 786 genes were found to be differentially regulated. Genes were divided in six clusters (I-VI) based on their expression profiles (color coding for these clusters is depicted in an additional table): cluster I (Differential expression in unprotected mice, absent in protected mice), Cluster II (Differential expression in unprotected mice and protected mice), Cluster III (Differential expression in unprotected mice and in protected mice before and after challenge), Cluster IV (Differential expression in unprotected mice and additional differential expression as result of challenge in protected mice), Cluster V (Absent in unprotected mice but differential expression in protected mice) and Cluster VI (absent in unprotected mice but differential expression pre- and post-challenge in protected mice). (B) Transcriptomic profiles obtained on 2 days p.i. in unprotected and 2 days p.c. protected mice were compared by plotting all 786 genes in a scatter plot and divide the genes in different fractions based on co-expression. The black solid lines are the thresholds for the significant FR (FR ≥ 1.5 or ≤ 0.67) compared to naive mice (D0 unprotected) for both unprotected and protected mice. Black dots represent genes that are not significantly regulated compared to naive mice (D0 unprotected) in both groups. The red solid lines represent the threshold for the significant FR (FR ≥ 1.5 or ≤ 0.67) of both unprotected 2 days p.i. and protected mice 2 days p.c. All red triangles represent genes that show significant differential expression (FR ≥ 1.5 or ≤ 0.67) between unprotected 2 days p.i. and protected mice 2 days p.c. In total, 212 genes were differentially expressed between both groups of which 108 genes were upregulated and 104 were downregulated. These genes were divided in eight fractions that are significantly up-regulated (1–4) or downregulated (5–8) in protected mice compared to unprotected mice and are further specified as heatmaps in S1B Fig. Dots with other colors (orange, green, brown, and blue) represent genes that are significantly regulated in unprotected and/or protected mice compared to naive mice (D0 unprotected) but these genes are not differentially regulated between unprotected 2 days p.i. and protected mice 2 days p.c. (C-D) A selection of eight terms (KEGG-pathways and GO-BP terms) found enriched in the ORA of the 786 genes and the kinetics over time of indicated terms is depicted. (C) Kinetics was determined by averaging the FR for each term at each time point and is expressed on LN-scale. (D) For each enriched term, the Benjamini score and the number of upregulated (red) and downregulated (green) genes in the protected mice and unprotected mice is shown.

