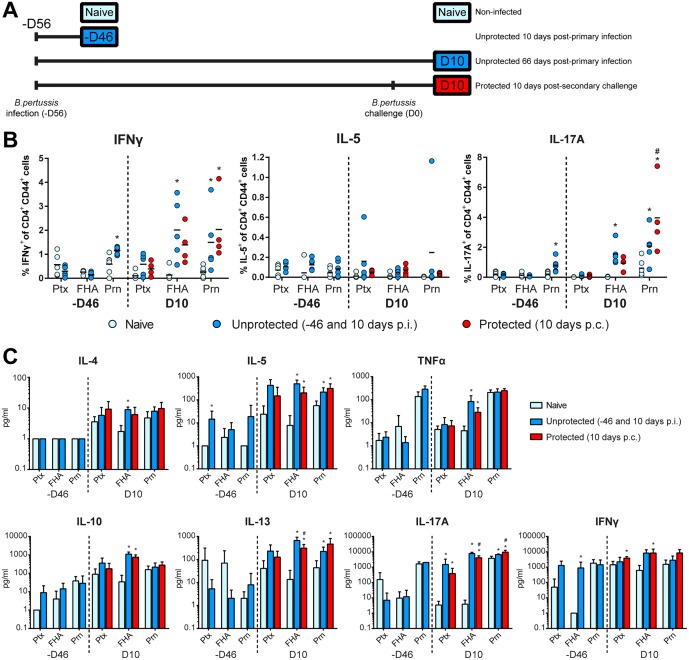
Fig 8. Systemic T-cell responses in unprotected and protected mice.
(A) Study design is depicted for the collection of splenocytes in two different experiments (-D46 and D10). The first experiment (-D46) included unprotected mice 10 days p.i. and naive mice. The second experiment (D10) included unprotected mice 66 days p.i., protected mice 10 days post-secondary challenge, and naive mice. Splenocytes were in vitro restimulated with Prn, FHA or Ptx for 8 days. (B) The percentages of IFNγ-, IL-5-, and IL-17A-producing CD4+CD44+ T-cells were determined using ICS (n = 6). (C) Cytokine levels of IL-4, IL-5, IL-10, IL-13, IL-17A, IFNγ, and TNFα in supernatant after 7 days of stimulation were determined by using a MIA. Results (mean of n = 6) are corrected for the background level in the presence of medium as control. Statistical differences between the groups were detected for the ICS with a non-parametric Mann-Whitney test and for the MIA with a Student t-test on the log-transformed data. * = p<0.05 experimental group versus naive group, # = p<0.05 protected group (D10) versus unprotected group (D10).

