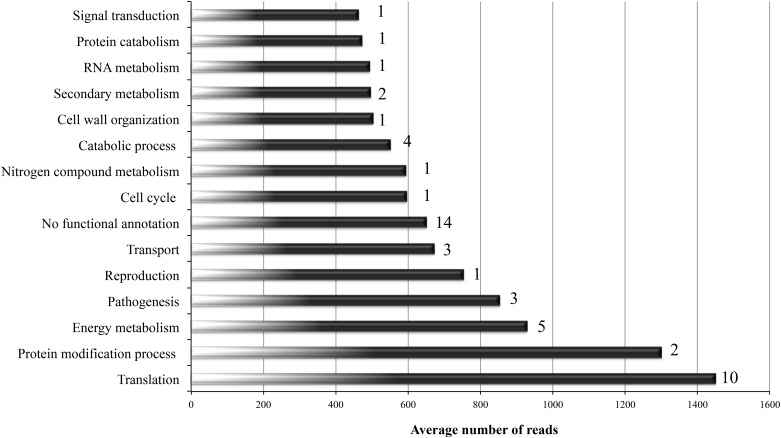
Fig 2. The most expressed GO categories in the epiphytic transcriptome of P. xanthii.
Representation of the number of average reads within the most expressed GO categories in the P. xanthii epiphytic cDNA library. For each category, the number of genes within the group of Top50 most expressed transcripts is shown on the right side of the bars. See S2 Table for details on Top50 most expressed genes.

