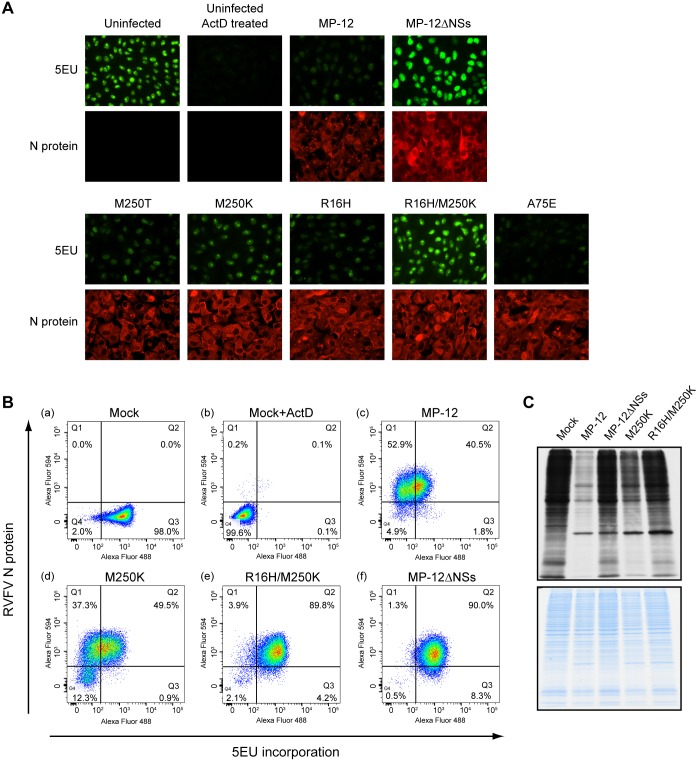
Fig 2. Effects of NSs mutants on host general transcription.
(A) Fluorescence microscopic analysis of newly synthesized RNAs. Vero E6 cells were mock infected (uninfected), mock infected and ActD treated (Uninfected ActD treated) or infected with MP-12 or its mutants at an m.o.i. of 3. At 16 h p.i., cells were incubated in the presence of 5EU for 1 h. The incorporated 5EU were visualized by using Alexa fluor 488 conjugated azide (5EU), and viral N protein was stained by anti-N antibody followed by Alexa fluor 594 conjugated secondary antibody (N protein). Fluorescence microscopic analysis was performed to detect newly synthesized RNAs. (B) Flow cytometric analysis of newly synthesized RNAs in infected cells. Vero E6 cells were mock infected, mock infected and ActD treated, or infected with MP-12, MP-12-M250K, or MP-12-R16H/M250K, at an m.o.i. of 3. 5EU and anti-N antibody were used to label newly synthesized RNAs and N proteins, respectively, as described in (A). Then the cells were subjected to Flow cytometric analysis. The density dot plot was divided into four quadrants (Q1, Q2, Q3, and Q4). Quadrant Q1 (Upper left quadrant): RVFV N protein positive and low activity of RNA transcription. Quadrant Q2 (Upper right quadrant): RVFV N protein positive and high activity of RNA transcription. Quadrant Q3 (Lower right quadrant): RVFV N protein negative and high activity of RNA transcription. Quadrant Q4 (Lower left quadrant): RVFV N protein negative and low activity of RNA transcription. (C) Autoradiography of radiolabeled proteins in mock infected cells and infected cells. Vero E6 cells were mock infected (mock) or infected with MP-12 or its mutants at an m.o.i. of 3. At 16 h p.i., cells were incubated with 35S-methionine/cysteine for 1 h. Whole cell lysates were resolved by SDS-PAGE and visualized by autoradiography (top panel) or Coomassie Blue staining (bottom panel).

