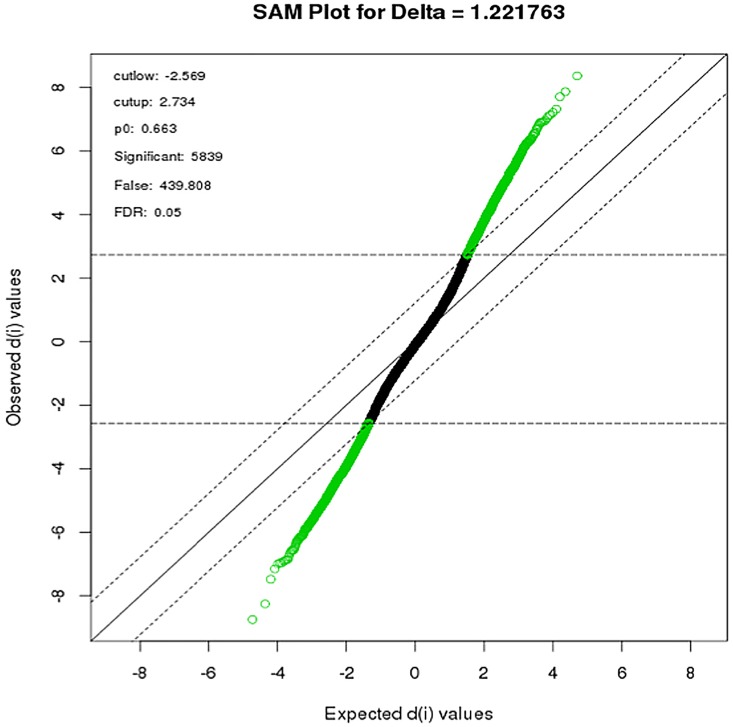
Fig 1. SAM plot of maternal gene expression during the course of pregnancy:
Differentially expressed gene-probes were identified by plotting the Observed test scores (di) against expected scores at a threshold of delta = 1.22 (parallel lines) and FDR = 0.05. 2734 genes had d-values greater than the expected d-value (up regulated) while 2589 had d-values lower than expected (down-regulated). Modified t-test, adjusted for multiple testing (BH), adjusted p-value <0.05.

