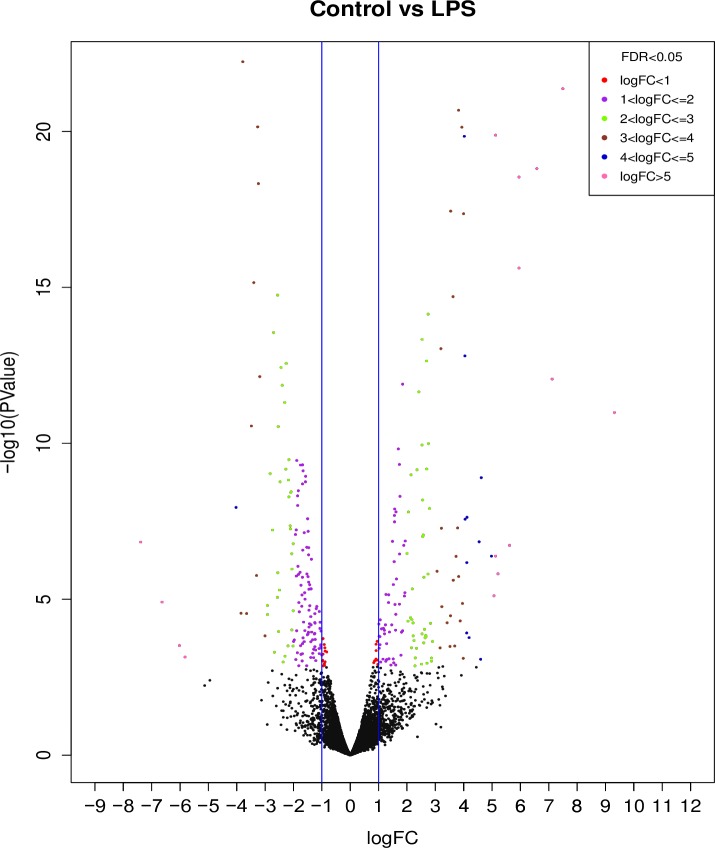
Fig 3. A volcano plot of genes with differential expression profiles after a 1 hr treatment with LPS.
Positive values on the X-axis indicate genes with increased transcript abundance, and negative values indicate genes with decreased transcript abundance. Black dots indicate genes that are greater than the false discovery rate (fdr) of 0.05, and the vertical blue bars delineate a threshold of 1 fold change.

