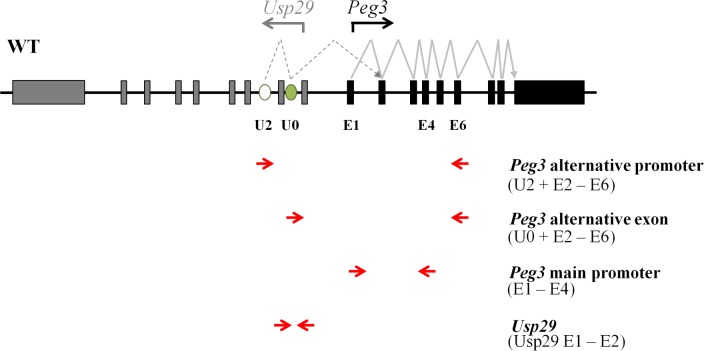
Fig 1. Schematic representation of the exon structures of mouse Peg3 and Usp29.
Gray and black boxes indicate the exons of Usp29 and Peg3, respectively. The transcriptional direction for each gene is represented with an arrow. The open and closed ovals represent the alternative 1st exon U2 and an additional exon U0, respectively. The arrows below the map indicate the directions of primers: U2 or U0 was coupled with E6 (exon 6) to target the alternative promoter U2 for Peg3; E1 (exon 1) was coupled with E4 (exon 4) to target the main promoter of Peg3; and the Usp29 E1-E2 (exon 1 and 2) was used to target the promoter of Usp29.

