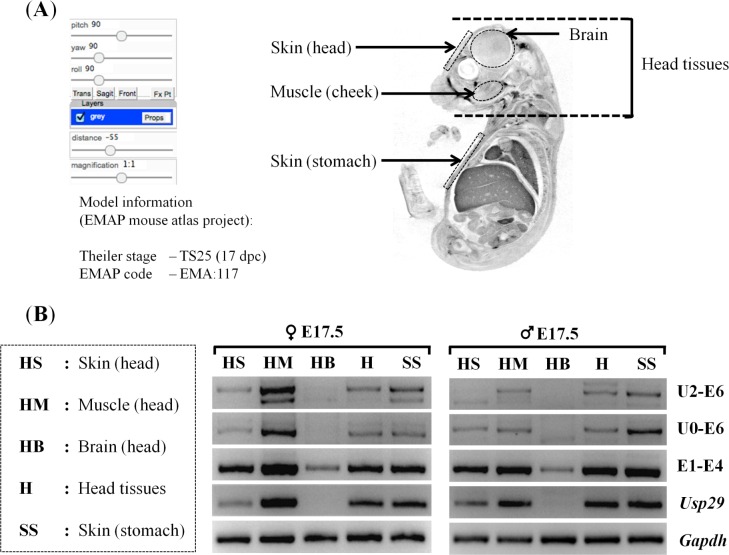
Fig 3. Spatial expression patterns of Peg3 promoters.
(A) The tissues used for RNA isolation were visualized using the image, which was derived from the EMAP mouse atlas project (http://www.emouseatlas.org), code EMA: 117 to indicate the proper anatomy of a 17-dpc embryo of a sagittal section [28]. The dotted areas indicate the regions where total RNA was isolated, including head skin (HS), cheek muscles (HM), brain (HB), the entire head tissues (H), and stomach skin (SS). (B) Spatial expression patterns of the Peg3 promoters. The two RT-PCR panels show the tissue-specific expression patterns observed from the female (left) and male (right) of E17.5 embryos. The primer set U2-E6 and U0-E6 were designed to survey the expression patterns of the U2 promoter of Peg3, while the primer set E1-E4 and Usp29 were designed to survey the expression profile of the main promoter of Peg3 and Usp29, respectively. The different amounts of cDNA between samples were normalized with the expression levels of Gapdh. The series of analyses were repeated three independent trials.

