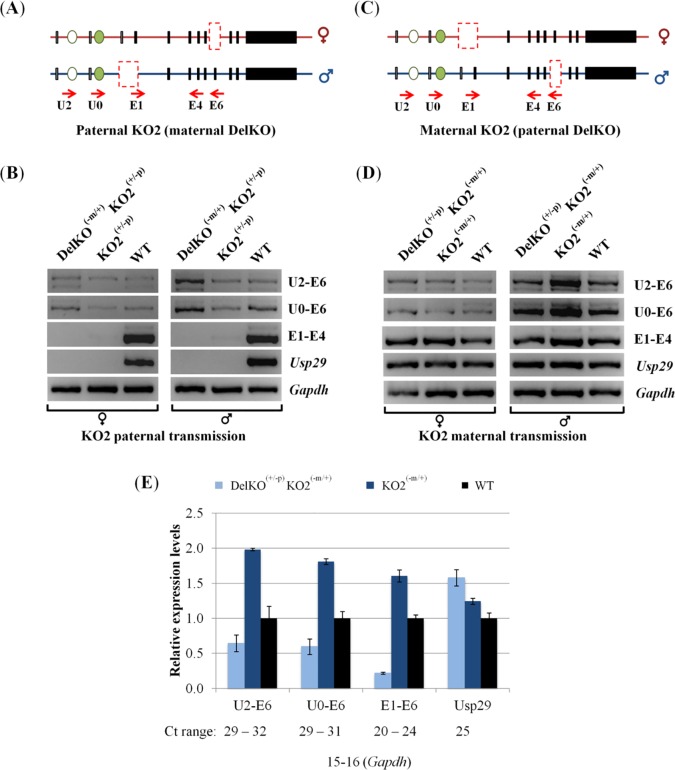
Fig 4. Deletion effects of the 4-kb Peg3-ICR on the U2 promoter.
(A,C) A reciprocal cross of mouse breeding experiments were performed to derive two types of the pups with the paternal and maternal transmission of KO2 and DelKO (A) and the pups with the opposite transmission of the two alleles (C). The solid boxes indicate the position of the exons of Peg3 and Usp29, while the ovals represent the upstream alternative exons. The dashed boxes indicate the deleted regions, exon 6 for DelKO and the 4-kb ICR containing the bidirectional promoter for Peg3 and Usp29 for KO2. (B,D) The pups with three different types were used for RNA isolation and subsequent RT-PCR analyses, including wild-type (WT), single heterozygotes for KO2 (KO2+/-p or KO2-m/+), and double heterozygotes (DelKO-m/+ KO2+/-p or DelKO+/-p KO2-m/+). The expression levels of each promoter were compared among the pups with these genotypes. The different amounts of cDNA between samples were first normalized with the expression levels of Gapdh, and the normalized cDNA were compared among the three samples per each promoter. The primer set U2-U6 and U0-U6 were to detect the expression levels of the U2 alternative promoter, while the primer set E1-E4 and Usp29 were to detect the expression levels of the main promoter of Peg3 and the promoter of Usp29, respectively. (E) Expression level analyses using qRT-PCR. This set of cDNA was same as the male set shown in Fig 5D. The Ct values for each promoter was first normalized with an internal control (β-actin) and subsequently used for calculating the relative expression levels compared to the levels of WT. The range of Ct values are also shown below the graph to indicate the relative expression levels of each amplicon. This series of analyses was repeated using triplicate reactions for each sample with error bars indicating the standard deviations from the triplicates. The data was consistent with at least two independent qRT-PCR experiments as shown by S3 Fig.

