
Fig 4. Long-term follow up of retinal lesion development.
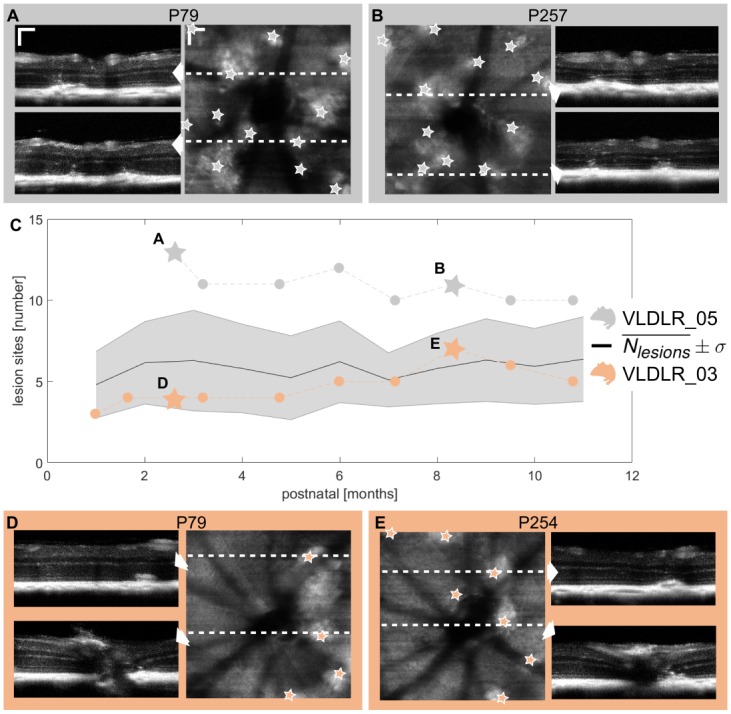
(A,B) Retinal lesions identified in reflectivity B-scans and en-face reflectivity variance projections at two different dates of measurement for VLDLR_05. (C) Mean number of retinal lesions and standard deviation clustered for each month during the longitudinal study. Retinal lesions were present in all animals at the initial measurement. Once the lesions were manifested, the number of lesions did not change significantly. The changes in the number of lesions are due to variations in the measurement position. The exact numbers of lesions are shown for two exemplary mice in gray and orange which correspond to the images shown in (A,B) and (D,E) respectively. The grey and orange stars mark the date of the measurement for the exemplary shown images. (D,E) Exemplary lesions identified for VLDLR_03. (scale bar: 100 μm.)