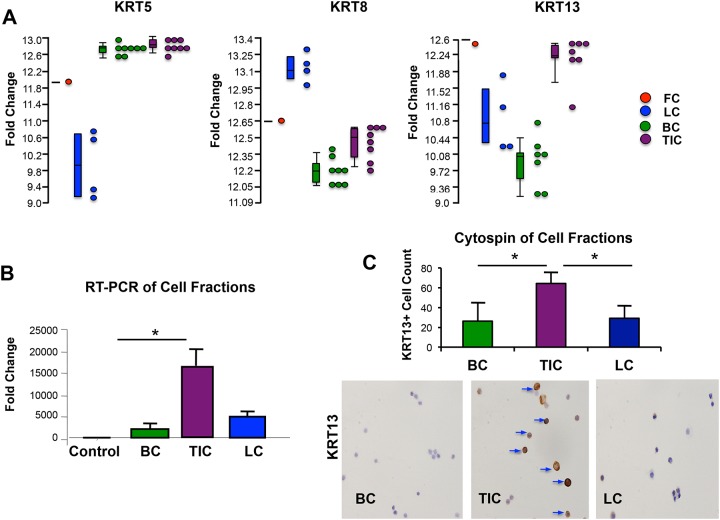
Fig 1. Differential KRT expression in fractionated prostate epithelial cells.
(A). Differential expression of the basal KRT5, luminal KRT 8 and KRT 13 among the four cell populations analyzed (FC-red dot, LC-blue dots, BC-green dots, and TIC-purple dots) from the Affymetrix Gene Chip Human U133 PLUS 2.0 Array analysis. Each dot represents an individual sample, with the exception of the FC, where 6 samples were pooled to generate sufficient RNA for analysis. (B) RNA was isolated from sorted cell fractions generated from 3 unique prostate tissue specimens and evaluated via Quantitative RT-PCR. Unfractionated total prostate cell control is represented by the black column, Epcam+CD44+CD49fHi basal cells (BC) represented by green column, Epcam+CD44-CD49fhi tubule initiating cells (TIC) represented by purple column, and Epcam+CD44-CD49fLo luminal cells (LC) represented by blue column. TIC had significantly higher expression than BC (p<0.05). (C) KRT13 immunostaining of cytospin slides of sorted cell fractions (BC, TIC, and LC) demonstrates relative abundance of KRT13+ cells, designated by brown staining, within the TIC fraction relative to BC and LC. The bar graph demonstrates the average cell count of KRT13+ cells per/cytospin slide (average of 3–5 slides, P<0.05).

