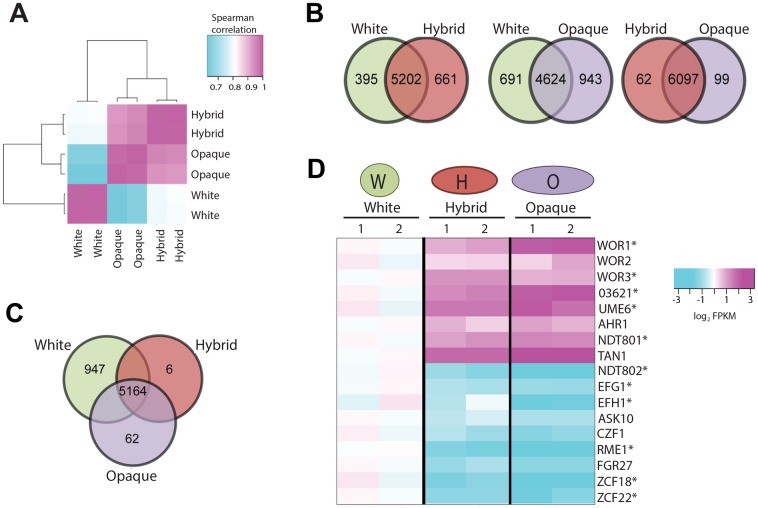
Fig 2. Gene expression profiling of C. tropicalis cells in the white, hybrid, and opaque states.
(A) Global comparison of RNA-Seq expression profiles for white, hybrid, and opaque cells. Figure shows the spearman correlation coefficients between -the transcript counts for each sample as a heat map. The two biological replicates for each cell state are highly correlated (0.998–0.999). White and opaque profiles show the least correlation (avg. of 0.202), with a higher correlation between opaque-hybrid (avg. of 0.797) than hybrid-white (avg. of 0.712) profiles. (B) Differentially expressed genes (2-fold cutoff and q-value<0.001) between white-opaque, white-hybrid, and hybrid-opaque cell types. (C) Differentially expressed genes (2-fold cutoff and q-value<0.001) among the three phenotypic states. (D) RNA-seq expression levels of established or putative transcriptional regulators involved in the switch in C. tropicalis white (CAY3051), hybrid (CAY3393), and opaque (CAY3053) states. Asterisks denote genes expressed at a significantly different level between cell states, and the two columns indicate data from independent experiments.

