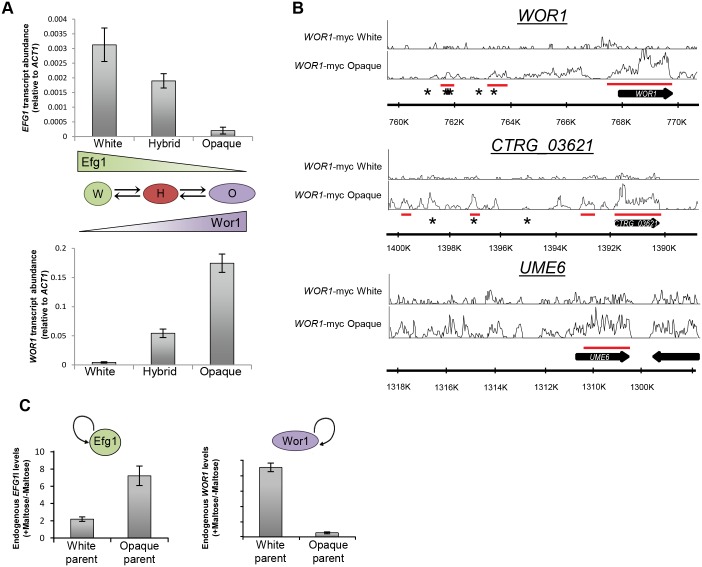
Fig 4. Analysis of the role of Wor1 and Efg1 in C. tropicalis tristability.
(A) Total WOR1 and EFG1 expression was assayed by qRT-PCR in C. tropicalis white, hybrid, and opaque cells. Error bars are standard deviations from three replicate experiments. The tristable states are depicted by graded expression of WOR1 and EFG1. In white cells Efg1 expression is high and Wor1 expression is low, in hybrid cells Efg1 and Wor1 are expressed at intermediate levels, and in opaque cells Wor1 expression is high and Efg1 expression is low. (B) Determination of Wor1 binding to genomic regions in white and opaque cells using ChIP-Seq. DNA binding by Wor1 protein was observed at discrete sites within the WOR1 and CTRG_03621 promoters, as well as within WOR1, CTRG_03621, and UME6 ORFs in opaque cells. The y-axis represents density of coverage. Underlined regions in red indicate regions of significant binding compared to the untagged control (see Materials and Methods). Asterisks denote positions corresponding to the C. albicans Wor1 DNA binding motif. (C) Transcript abundance of the endogenous WOR1 or EFG1 transcript when ectopic pMAL2-WOR1 or pMAL2-EFG1 was induced, respectively. Relative expression changes were determined between inducing conditions (+Maltose) and non-inducing conditions (-Maltose) and demonstrate auto-activation by each factor.

