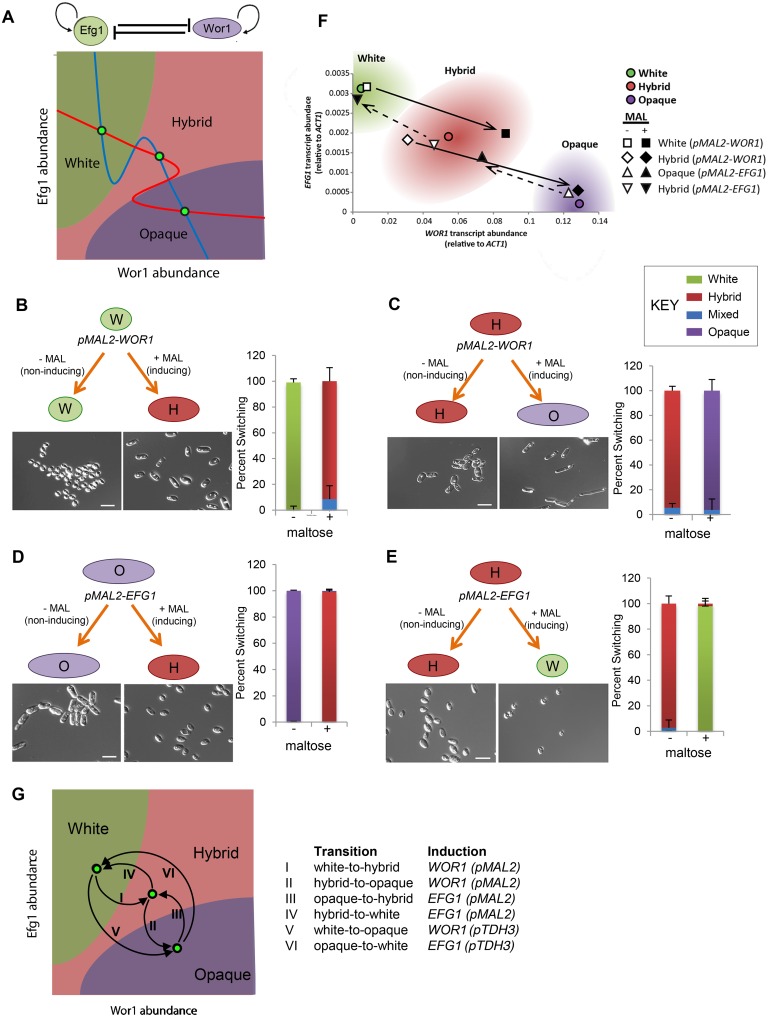
Fig 5. Testing a symmetric SATS model of tristability.
(A) Model of a self-activating toggle switch (SATS) that is proposed to operate between Wor1 and Efg1. The nullclines (lines in the x-y planes) are plotted for Wor1 (red) and Efg1 (blue) based on the SATS model. Intersection of the nullclines (green circles) indicate stable states corresponding to the white, hybrid, and opaque phenotypic states. Regions of the Wor1/Efg1 spacescape are color coded according to the predicted resulting phenotypic state. (B-E) To test this model, pMAL2-WOR1 (B, C) or pMAL-EFG1 (D, E) were ectopically expressed in different cell states. Cells containing these constructs were plated onto media containing maltose (+MAL, inducing conditions) or lacking maltose (-MAL, non-inducing conditions) and grown at 30°C for 7 d. Phenotypes were defined by microscopic analysis of cell morphologies (see representative cell pictures) and switching frequencies calculated (see graphs). Scale bar, 10 μm. Error bars, standard deviation. “Mixed” refers to colonies with a mixture of cellular phenotypes. (F) WOR1 and EFG1 transcript levels define C. tropicalis white, hybrid, and opaque states. Transcript levels for control cells of each state are depicted as colored circles. Cells containing the pMAL2-WOR1 or pMAL2-EFG1 construct are depicted as either open (-MAL) or filled (+MAL) symbols. Arrows indicate the shift in WOR1 and EFG1 levels following induction of either pMAL2-WOR1 or pMAL2-EFG1. WOR1 was induced in white and hybrid states, whereas EFG1 was induced in hybrid and opaque states. (G) Schematic summarizes how six different transitions between white, hybrid, and opaque states can be induced by ectopic expression of WOR1 and EFG1 genes.

