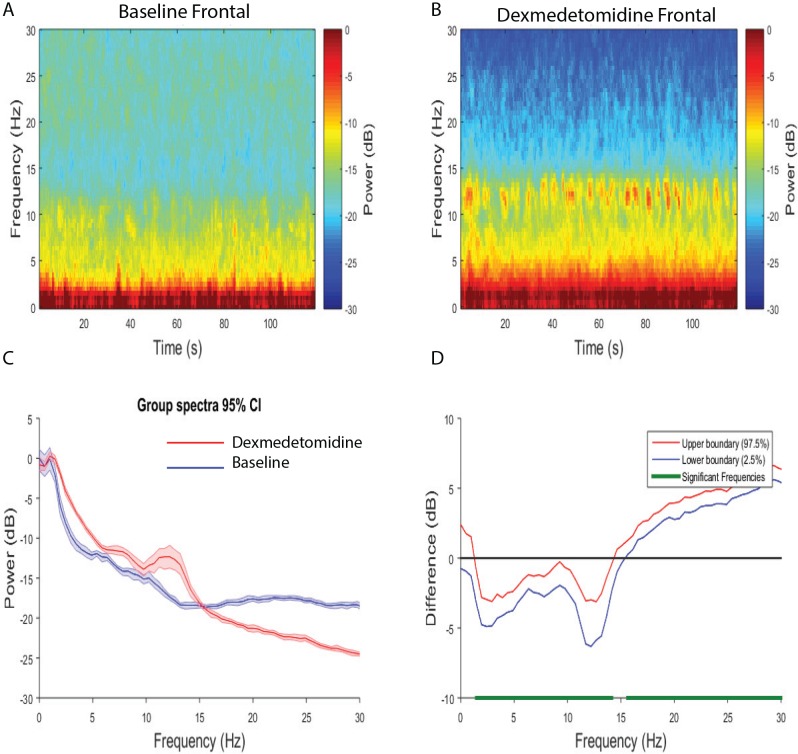
Fig 4. Spectral comparison of Baseline vs. Dexmedetomidine frontal electrodes.
(A, B) Median frontal spectrograms (n = 8). (C) Overlay of median dexmedetomidine frontal spectrum (red), and median baseline frontal spectrum (blue). Bootstrapped median spectra are presented and the shaded regions represent the 95% confidence interval for the uncertainty around each median spectrum. (D) The upper (red) and lower (blue) represent the bootstrapped 95% confidence interval bounds for the difference between spectra shown in panel C. We found that there were differences in power between baseline and dexmedetomidine frontal electrodes (dexmedetomidine > baseline, 1.5–14.2 Hz; baseline > dexmedetomidine, 15.6–30 Hz).

