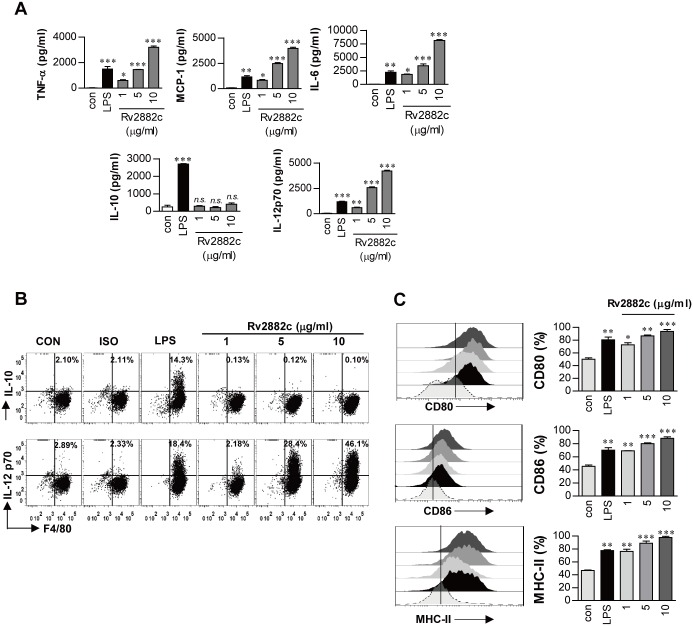
Fig 2. Rv2882c induced BMDM activation.
(A) BMDMs (1 × 10⁵/well) were stimulated with 100 ng/mL LPS or 1, 5, or 10 μg/mL Rv2882c for 24 h. (A) Quantities of TNF-α, MCP-1, IL-6, IL-10, and IL-12p70 in the culture supernatant were determined by ELISA. All data are expressed as the mean values ± SD (n = 3). Significance levels (*p < 0.05, **p < 0.01 or ***p < 0.001, determined by one-way ANOVA test) of the differences between the treatment data and the control data are indicated; treatments that were not significantly different are indicated by n.s. (B) Dot plots of the intracellular IL-12p70 and IL-10 concentrations in the F4/80+ BMDMs. The percentage of cells that are positive is shown in each panel. (C) The BMDMs were prepared as described in (A) and analyzed for the expression of surface markers using flow cytometry. The cells were gated on the F4/80+ BMDMs. The BMDMs were stained with anti-CD80, anti-CD86, and anti-MHC class II antibodies. The percentage of cells that are positive is shown in each panel. The bar graphs depict the mean values ± SD (n = 3). The levels of significance (*p < 0.05, **p < 0.01 or ***p < 0.001, determined by one-way ANOVA test) of the differences between the treatment data and the control data are indicated.

