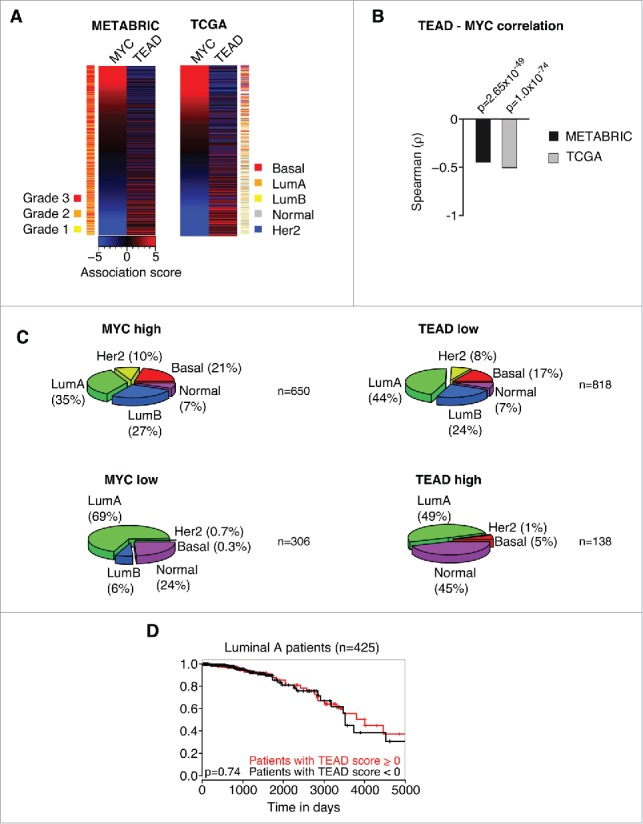
Figure 2.

MYC and TEAD activity stratify human breast cancer patients. A: Association score analysis for MYC target genes and TEAD target genes (C3 WGGAATGY_V$TEF1_Q6 gene set) in the METABRIC or TCGA breast cancer data sets, respectively. The association score for the expression of MYC and TEAD target genes was calculated for every single patient and subsequently sorted according to the MYC association score. A negative association score describes the repression of the respective gene set, whereas a positive association score describes an induction of the respective gene set in the respective patient compared to the median. A color code is given to annotate the grade (METABRIC) or subtype (TCGA) per patient. LumA = Luminal A; LumB = Luminal B; Her2 = Her2-amplified. B: Spearman rank correlation and associated significance test for the correlation between MYC and TEAD activity as determined in A. C: Patients from the TCGA data set were stratified according to their association score (AS) for MYC and TEAD, respectively. The prevalence of breast cancer subtypes within the given groups is depicted as a piechart. MYC high: AS > −2; MYC low: AS ≤ −2; TEAD high: AS > 3; TEAD low: AS ≤ 3. LumA = Luminal A; LumB = Luminal B; Her2 = Her2-amplified. n denotes the number of patients per piechart. Please note that the breast cancer subtype information was not available for every patient in the TCGA data set. D: Kaplan-Meier plot for patients with a Luminal A subtype. The patients were stratified according to their TEAD activity (TEAD score > 0 ; TEAD score < 0, respectively) and analyzed for their disease-specific survival. The p-value was determined by a chi-square test.
