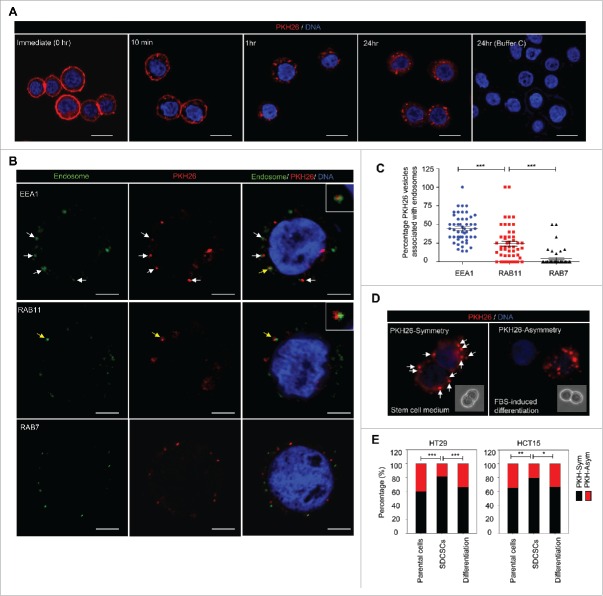
Figure 1.
The symmetrical distribution of PKH26-labeled subcellular compartments occurs in colorectal cancer stem cells. (A) The representative images for PKH26 dye labeling in HT29 cells at the indicated time points. PKH26 dye, red; DNA, blue. Scale bar = 20 μm. (B) The immunofluorescent pictures for showing the association of PKH26-labeled vesicles and endosome markers. PKH26 dye, red; endosome markers (EEA1, RAB11 and RAB7), green; DNA, blue. Scale bar = 5 μm. Arrows indicate the association or colocolization. Insert: magnified vesicle association indicated by yellow arrows. (C) The quantification results of association of PKH26-vesicles and indicated endosome markers in HT29 parental cells. Data represent mean ± SEM ***, p < 0.001 (Student's t test). (D) Representative images of symmetric or asymmetric segregation of PKH26-labeled vesicles in HT29 SDCSCs cultured under stem cell medium or in FBS-induced differentiation, respectively. PKH26 dye, red; DNA, blue. insert: phase pictures for showing paired-cells. (E) The percentage of the asymmetry/symmetry of PKH26-labeled vesicles in parental cells, SDCSCs and serum-differentiated SDCSCs (differentiation) in HT29 and HCT15 cells. n (total counted cells over 2 independent experiments) = 142, 223, 83, 144, 196, and 54 for HT29 parental cells, HT29 SDCSCs, Differentiation (HT29 SDCSCs), HCT15 parental cells, HCT15 SDCSCs, and Differentiation (HCT15 SDCSCs), respectively. PKH-Sym, symmetric segregation of PKH26-labeled vesicles; PKH-Asym, asymmetric segregation of PKH26-labeled vesicles. The p-value is estimated by χ2 test. *, p < 0.05; **, p < 0.01 ***, p < 0.001.

