
Figure 2.
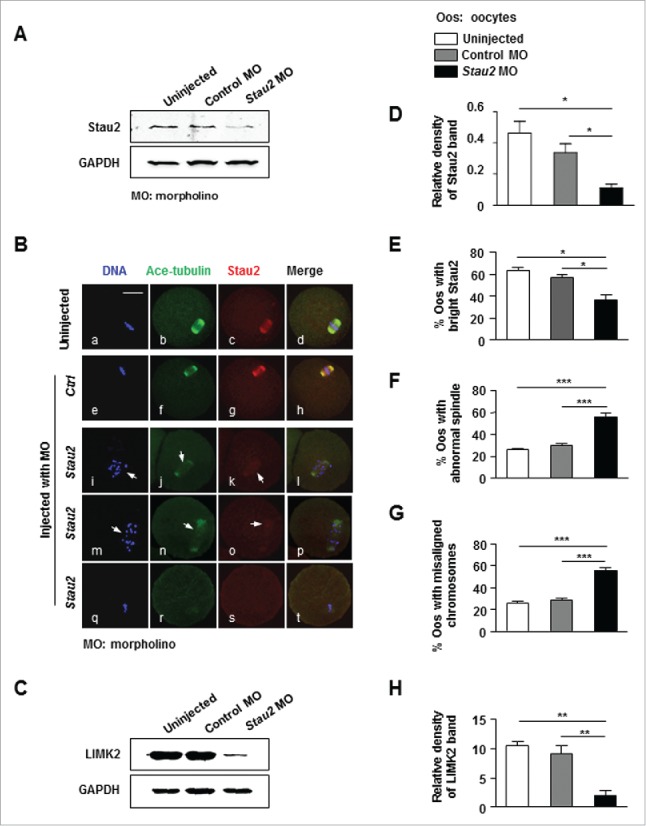
Knockdown of Stau2 disrupted the spindle structure and alignment of chromosome. Oocytes were cultured for 8 h in normal culture medium after microinjected with 1 mM Stau2 morpholino, and then collected for analysis with western blot and immunofluorescence. Oocytes uninjected or injected with 1 mM non-specific morpholino sequence were used as controls. A. The protein expression of Stau2 was effectively knocked down with morpholino oligo in mouse oocytes. Western blot analysis showed that Stau2 protein was significantly reduced in Stau2 morpholino group than that in 2 control groups. GAPGH was used as a loading control. B. Immunofluorescence analysis detected weak or no Stau2 expression after morphorlino treatment. In two control groups, the chromosomes were properly aligned (a, e) within a bipolar MI spindle (b, f), meanwhile Stau2 was pronouncedly labeled in symmetric organization (c, g) and overlapped with the meiotic spindles (d, h). In Stau2 morpholino group, the chromosomes were not aligned, but scattered or decondensed (i, m, q), spindle was abnormally formed (j, n, r) the fluorescence intensity of Stau2 was heavily reduced (k, o: arrows) or hardly detected (s). Microtubules were visualized in green, Stau2 was visualized in red and DNA was labeled in blue. Scale bar = 20 μm. C. The protein expression of LIMK2 was significantly reduced in mouse oocytes treated with Stau2 morpholino oligo. Western blot analysis indicated that LIMK2 protein was markedly decreased in Stau2 morpholino group than that in 2 control groups. GAPGH was used as a loading control. D. Quantitative analysis of Stau2 expression in control and Stau2 morpholino group. Analysis with Image J software and statistical procedure demonstrated the gray level of Stau2 was obviously decreased in Stau2 morpholino group than that in uninjected group and control morpholino-injected group. E. The percentage of oocytes with normal Stau2 intensity in control and Stau2 morpholino group. Statistical analysis, combined with fluorescence, showed that the proportion of oocytes with bright Stau2 intensity was significantly lower in Stau2 morpholino group than that in uninjected group and control morpholino-injected group. F. Percentage of oocytes with abnormal spindle in control and Stau2 morpholino group. Statistical analysis, combined with fluorescence, demonstrated that the propotion of oocytes with abnormal spindle was significantly higher in Stau2 morpholino group than in 2 control groups. G. Percentage of oocytes with misaligned chromosomes in control and Stau2 morpholino group. Statistical analysis, combined with fluorescence, illustrated that the proportion of oocytes with misaligned chromosomes was significantly higher in Stau2 morpholino group than in 2 control groups. H. Quantitative analysis of LIMK2 protein level in control and Stau2 morpholino group. Analysis with Image J software and statistical procedure showed that the gray level of LIMK2 was pronouncedly reduced in Stau2 morpholino group than that in control groups.