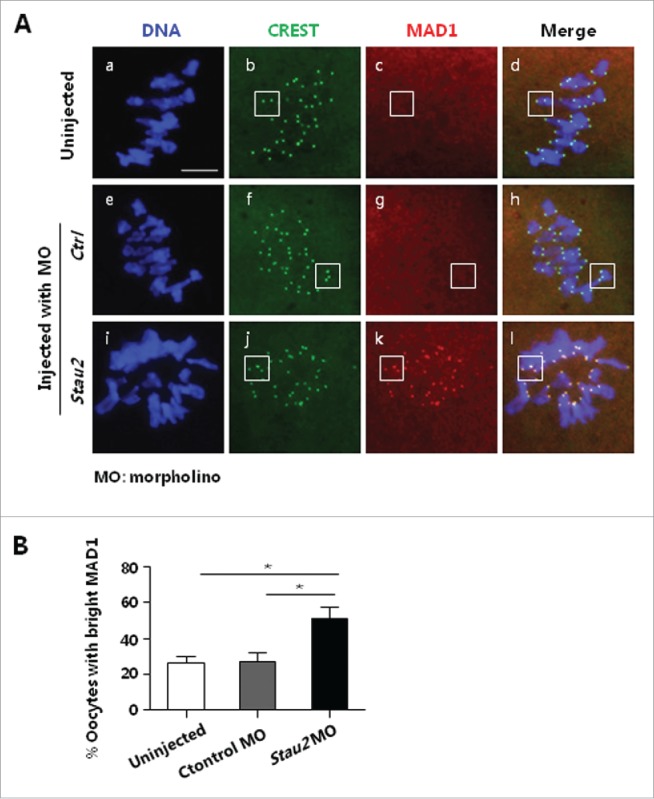
Figure 5.

SAC activation in MI oocytes with depleted Stau2 expression. At the end of 8 h maturation culture, MI oocytes were processed for immunostaining with SAC protein MAD1, the proportion of oocytes with weak or no MAD1 signal was statistically analyzed. MAD1 was faintly detected in control oocytes (A, b-d, f-h: boxes), but obviously probed on centromere area in oocytes treated with Stau2 morpholino (A, j-l: boxes).Statistical analysis indicated that the number of oocytes with bright MAD1 was significantly higher in Stau2 morpholino group than that in 2 controls (B). CREST was visualized in green, MAD1 was visualized in red and DNA was labeled in blue. Scale bar = 20 μm.
