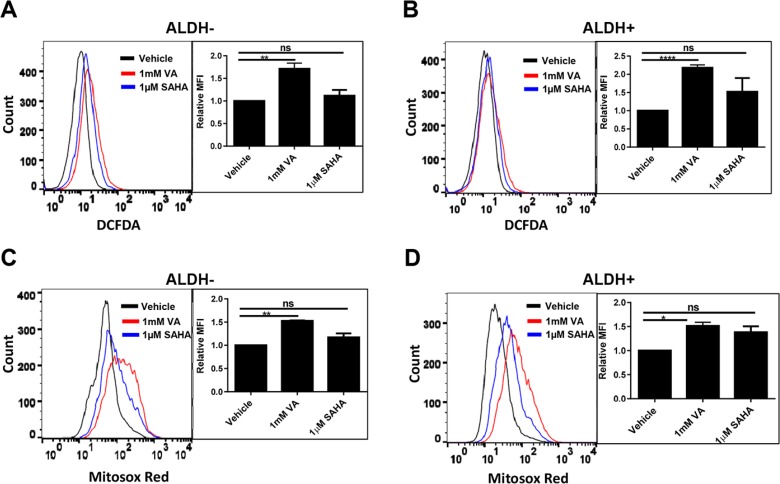
Figure 3. ROS levels in in HDACi-CSCs and differentiated cancer cells.
(A and B) Flow cytometric analysis of ROS with 2′-7′-dichlorofluorescein diacetate (DCF-DA). ROS concentrations were higher in ALDH− (A) and ALDH+ (B) cells treated with VA versus vehicle-treated controls. (C and D) Flow cytometric analysis of mitochondrial superoxide with MitoSOX Red. Superoxide levels were higher in VA-induced HDACi-CSCs from ALDH− (C) and ALDH+ (D) cells than in vehicle-treated differentiated cells. Representative overlaying merged graphs are shown with bar graphs summarizing quantification of the DCFDA and Mitosox-red data from several experiments.

