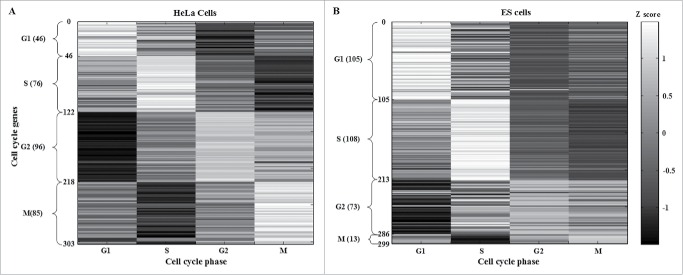
Figure 2.
Identification of HeLa and ESC cell cycle genes after applying the cell cycle projection method. HeLa and ES cells cell cycle genes were selected according to the maximal phase-specific ability value, i.e., ai,k* in (3). The right bar represents the Z score, from maximum (white) to minimum value (black). The phase-shift of cell cycle genes can be observed as white blocks along the diagonal.

