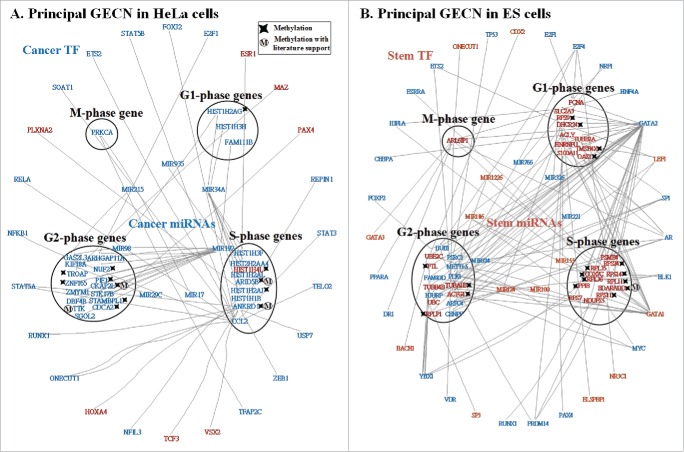
Figure 5.
Principal networks of HeLa (A) and ES (B) cells. To find the principal networks, we assumed that they contained cell cycle genes with top PGNP projection values and that each of the 4 cell cycle phase groups involved at least one cell cycle gene. We identified the principal GECNs from the specific GECNs shown in Figure 4. Genes/TFs/miRNAs in blue and red denote activated expression in HeLa and ES cells, respectively (p-value ≤ 0.05).

