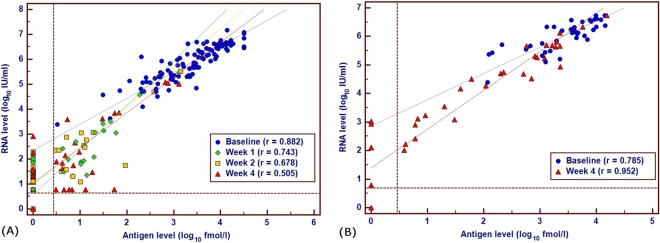
Fig 2.
Scatter plots depicting the correlation between HCV RNA (log10 IU/ml) and HCVcAg (log10 fmol/l) measurements in samples from the cohorts receiving TVR (A) and BOC (B) at early time points. The lower left hand corner restricted by the dashed lines indicates the area where both RNA and antigen are not detected by the respective assays.

