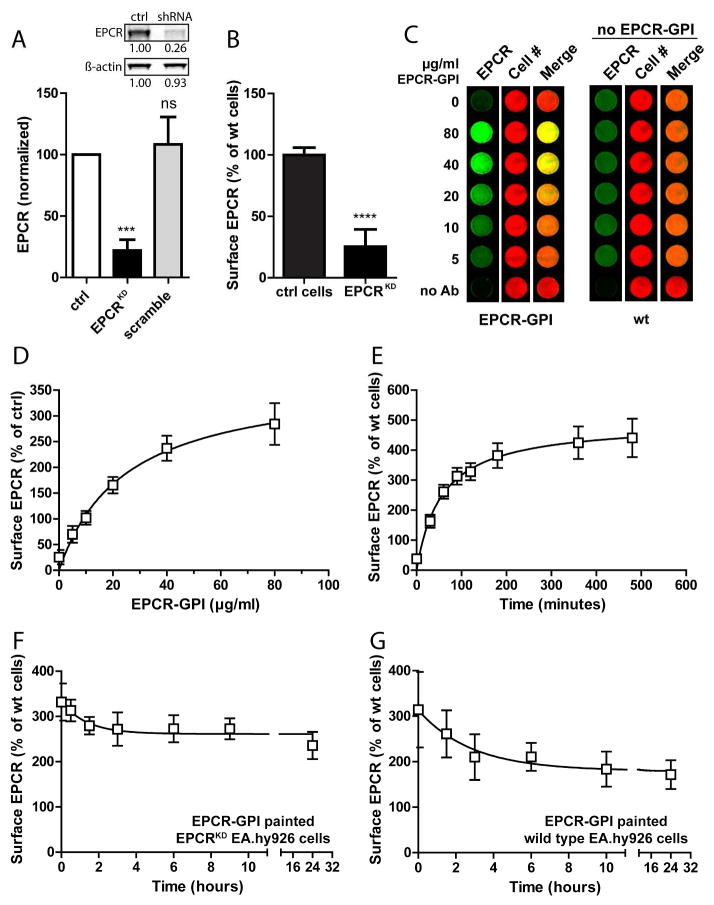
Figure 4. Analysis of EPCR-GPI cell painting efficiency.
The painting efficiency for EPCR-GPI was determined on EA.hy926 EPCRKD cells. (A) Knockdown of EPCR was quantified by Western blot of cell lysates and normalized to wild type EA.hy926 cells (ctrl) and β-actin. A representative blot is shown in the inset. (B) Cell surface EPCR expression on EPCRKD cells was measured with an on-cell Western assay and normalized to wild type EA.hy926 cells (ctrl cells). (C) EPCR-GPI painted EPCRKD cells were analyzed for surface EPCR levels by on-cell Western. Painted EPCRKD cells (EPCR-GPI) and untreated wild type EA.hy926 cells (wt) were stained for EPCR (green) and cell number using Draq5 (red). Shown is a representative image of three independent experiments. Note that wt cells did not receive paint. (D) Quantification of EPCR cell surface levels after painting EPCRKD cells with EPCR-GPI. EPCR levels were corrected for background signal (no Ab) and normalized for cell number. Surface EPCR levels on wild type EA.hy926 cells were set at 100%. (E) EPCRKD cells were painted with 80 μg/ml EPCR-GPI for 0–180 minutes to determine the optimal time for painting. Loss of EPCR-GPI from the cell surface on (F) painted EPCRKD cells or (G) painted wild type EA.hy926 cells was analyzed in time. Cells were painted with 40 μg/ml EPCR-GPI for 90 minutes, washed in PBS (t=0) and fresh media was added to the cells to determine the stability of EPCR-GPI incorporation in the cell membrane in time. EPCR levels on untreated wild type cells were used as 100%. For all experiments mean ± SD of three independent experiments are shown. *** P < 0.001, **** P < 0.0001.

