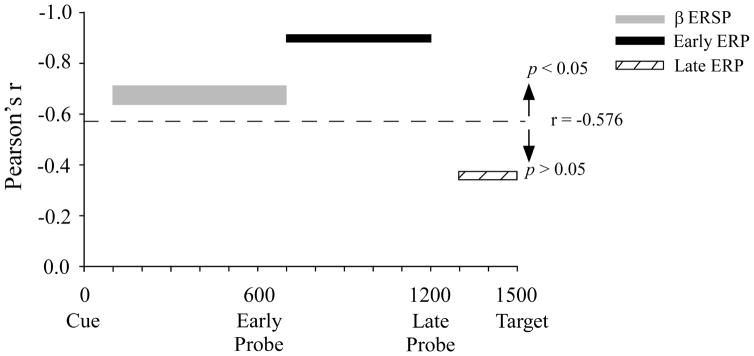
Figure 5.
Summary of the correlation results. Time plots showing the onset and offset of beta ERSP and auditory probe ERP measures that were significantly correlated to stuttering rate. Width of the beta ERSP bar indicates the range of correlations among three electrode sites (FCz, P5, P6). Early and late ERP correlations are show from electrode FCz.
 = cutoff for Pearson’s r to be significant.

