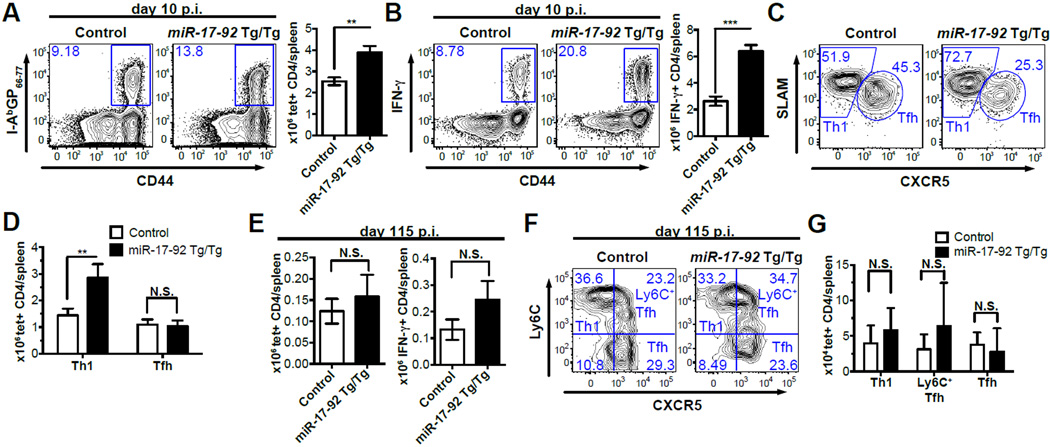
Figure 3. miR-17-92 over-expression preferentially enhances the Th1 effector response.
(A-D) Splenocytes from miR-17-92 Tg/Tg and control mice were collected on day 10 p.i.. (A) FACS plots of I-AbGP66-77 tetramer staining (gated on CD4 T cells) and number of I-AbGP66-77 tetramer+ CD4 T cells per spleen. (B) FACS plots of intracellular IFN-γ staining (gated on CD4 T cells), the number of IFN-γ+ CD4 T cells per spleen, and IFN-γ MFI. (C) FACS plots of CXCR5 and SLAM staining (gated on I-AbGP66-77 tetramer+ CD4 T cells). (D) Number of I-AbGP66-77 tetramer+ Th1 and TFH CD4 T cells per spleen. (E-G) Splenocytes of miR-17-92 Tg/Tg and control mice were collected on day 115 p.i.. (E) Number of I-AbGP66-77 tetramer+ CD4 T cells and IFN-γ+ CD4 T cells per spleen. (F,G) FACS plots of CXCR5 and Ly6C and number of I-AbGP66-77 specific Th1, Ly6C+ TFH, and TFH memory CD4 T cells. Results are representative of at least three independent experiments with n≥3.

