
Figure 4. Defective G2/M cell-cycle progression of Gadd45b−/− MEFs.
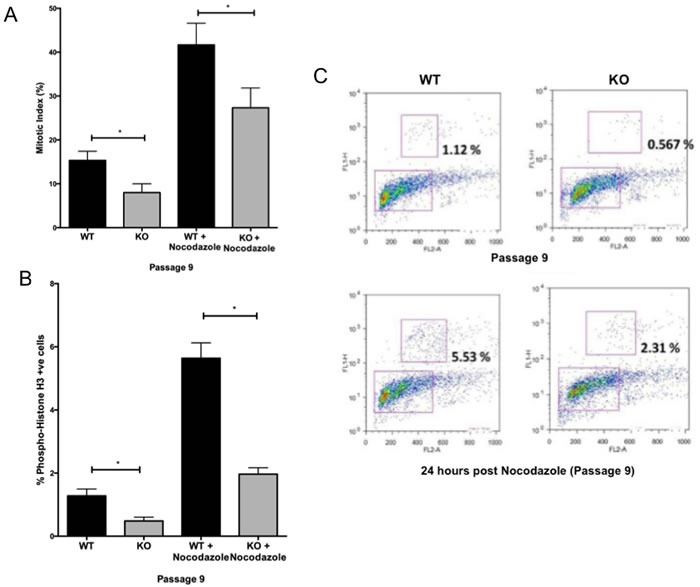
A. The mitotic index was determined in Gadd45b+/+ (WT) and Gadd45b−/− (KO) MEFs cultured at 21% oxygen at passage 9. Nocodazol treated cells were used as experimental control. B. Number of phosphorylated Histone H3- positive cells in Gadd45b+/+ and Gadd45b−/− MEFs cultured at 21% oxygen (passage 9) using phosphospecific anti-Histone H3 (Ser10) antibodies. Mean values from three independent experiments are shown. C. Scatter plots show phospho-histone H3 (y axis) plotted against PI (DNA content, x axis), gated to quantify mitotic (phospho-histone H3 positive) cells (upper box). *P < 0.05.