
Figure 1. Characterizing the partial EMT phenotype.
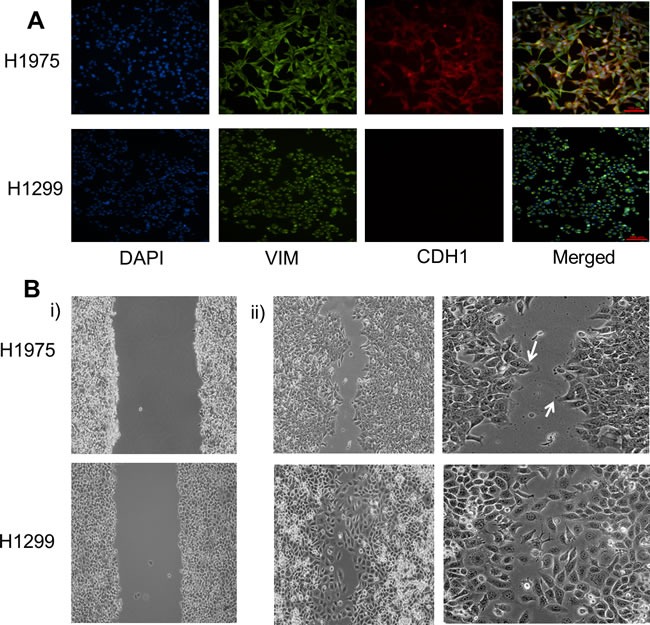
A. Expression of CDH1 (E-cadherin) and VIM (Vimentin) examined by immunofluorescence staining. Scale bar 100 μm. B. Scratch assay of H1975 and H1299 depicting different cell motility patterns. White arrows denote finger-like projections seen in H1975 cells. Panel i) shows the condition at the beginning of scratch assay (t = 0 hours) whereas ii) shows for t = 12 hours for H1299 and t = 16 hours for H1975 cells.