
Figure 4. Knockdown of GRHL2 and OVOL2 in H1975 cells, and expression values of GRHL2, CDH3, and OVOL in different PC-3 clones.
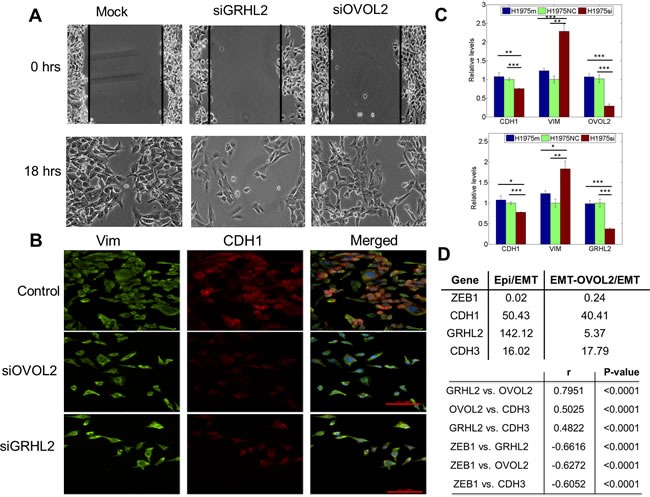
A. Scratch assay of H1975 cells for the control case, and when treated with siRNA against GRHL2 and OVOL2, depicting different cell motility patterns. B. Expression of CDH1 (E-cadherin, red) and VIM (Vimentin, green) examined by immuno-fluorescence staining. Scale bar 100 μm. The blue color stains DAPI. C. Quantitative RT-PCR for CDH1, VIM, GRHL2, and OVOL2 after and before treatment with siRNAs against GRHL2 and OVOL2. Top panel is for siRNA against GRHL2, bottom one for that against OVOL2. H1975si shows the case when cells are treated with siRNA, H1975 NC denotes the negative control, and H1975m denotes mock case. *, p < = 0.05; **, p < 0.005; and ***, p < 0.0005. Error bars represent standard deviation, n = 3. D. (top) Fold-change in expression levels (log2) of GRHL2, OVOL2, CDH3, and ZEB1 in PC3-Epi vs. PC3-EMT, and PC3-EMT-OVOL2 vs. PC-EMT clonal cell lines. (bottom) Correlation analysis for GRHL2, OVOL2, CDH3, and ZEB1 expression in NCI-60. Pearson correlation coefficients (r) and p-values (two-tailed) are given.