
Figure 7. Network motifs that help maintain the hybrid E/M phenotype.
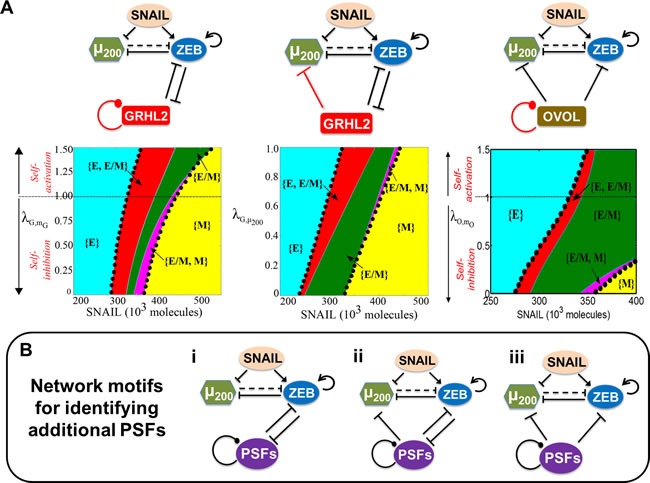
A. Top row denotes the different circuits that are investigated; the link whose strength is varied is depicted in red. Bottom row shows the phase-diagram of the miR-200/ZEB/GRHL2 circuit when driven by SNAIL and including a hypothetical self-regulatory link for GRHL ( denotes the strength of the self-regulation; indicates self-activation, implies self-inhibition, and indicates no self-regulation) (left), phase diagram of the miR-200/ZEB/GRHL2 circuit when driven by SNAIL and a hypothetical inhibitory link from GRHL2 to miR-200 (the smaller the value of , the stronger the inhibition) (center), and phase diagram for the miR-200/ZEB/OVOL2 circuit when driven by SNAIL and including a hypothetical self-regulatory link for OVOL ( indicates the strength of self-regulation: implies self-inhibition, implies self-activation, and shows no self-regulation) (right). In all these phase diagrams, the black dots bound the area of all phases that contain E/M as one of its phenotypes, and dark green region shows the phase when hybrid E/M phenotype need not co-exist with other phenotypes - {E/M} B. Proposed network motifs for identifying PSFs. The dot at the end of the self-regulatory link indicates that the PSF can potentially either self-activate or self-inhibit.