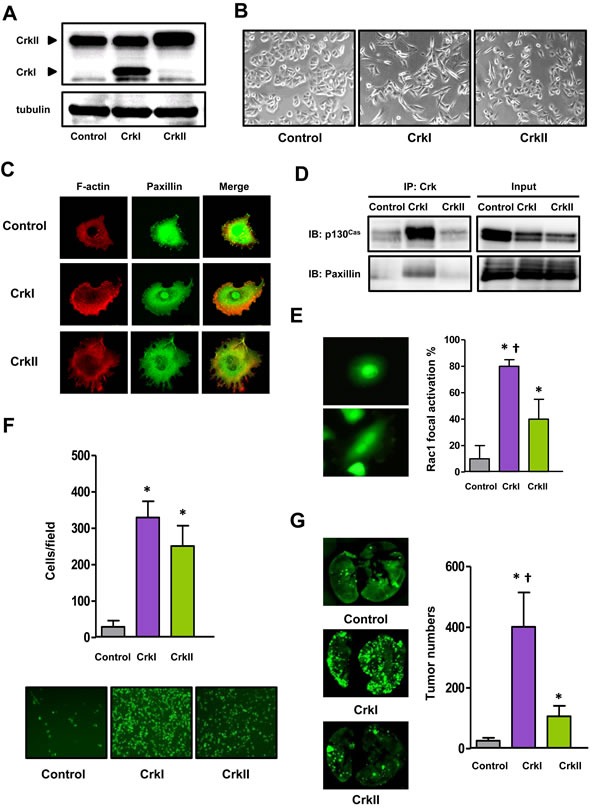
Figure 1. Crk induced EMT in human lung cancer A549 cells.

A. Immunoblotting of Crk levels in A549 cells. The molecular weights of CrkI and CrkII at 28 and 40 kDa, respectively, are indicated by arrow heads. Tubulin was used as an internal control. B. Phase-contrast microscopic analysis of Crk-expressing A549 cells. C. Immunofluorescence of actin (red) and paxillin (green) of Crk-expressing A549 cells. D. Association between Crk and p130Cas or paxillin by immunoprecipitation and immunoblotting. Input indicates total cell lysates. E. Immunofluorescence of activated Rac1 in Crk-expressing A549 cells. GST-PAK-RBD was used as a probe, and the proportion of positive cells with membrane ruffling was counted and displayed with control cells (gray bar), and CrkI- (purple bar) and CrkII- (green bar) expressing cells. *P < 0.05 versus control cells. †P < 0.05 versus CrkII cells. Values are means±SD from three independent experiments. F. Trans-endothelial assay for evaluation of motility of A549 cells expressing CrkI (purple bar) and CrkII (green bar). Bottom panels are the representative photographs. *P < 0.05 versus control cells. Values are means±SD from three independent experiments. G. Tail-vein injection assay for evaluation of the distant metastasis ability of A549 cells expressing CrkI (purple bar) and CrkII (green bar). Whole-mount GFP fluorescent images of lung metastasis from NOD mice at 28 days after tail vein injection with indicated A549 cells. The numbers of metastatic nodules were counted (right). *P < 0.05 versus control cells. †P < 0.05 versus CrkII cells. Values are means±SD from eight mice/group for each type of cells.
